
Binomial Distribution Dynamic Demo: Probability Histogram and Normal Approximati
Loading the math board and drawing, please wait…
In collections
UNSW MATH1131/1231 Algebra material
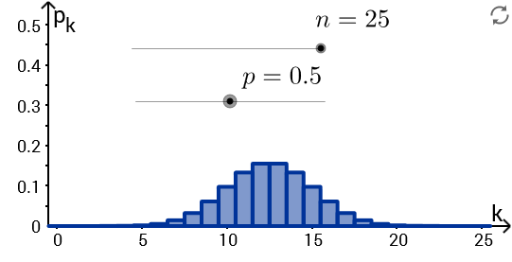
This GeoGebra example dynamically illustrates the binomial distribution's probability mass function and its approximation by the normal distribution. ① It demonstrates how the probability histogram of a binomial distribution approaches a bell-shaped normal curve as the number of trials n increases, visually conveying the central limit theorem. ② Core mathematical concepts include the binomial distribution, probability mass function, expected value μ=np, standard deviation σ=√(npq), continuity correction, and normal approximation. ③ Construction highlights: the Join and Sequence commands generate discrete point sequences; objects d, p, q, n, f, Plotf, mu, sigma, and n_max are defined, where p is the success probability, n is the number of trials, f is the probability function, Plotf renders the histogram, mu and sigma compute distribution parameters, and n_max controls the maximum trials for dynamic adjustment. ④ Suitable for high school to early college probability and statistics courses, it helps students explore how the binomial distribution's shape changes with parameters, the conditions for normal approximation, and interactive statistical concepts via sliders.
GeoGebra Commands & Parameters
Join({Sequence[((n! / ((i! * (n - i)!)) * p^(i)) * q^(n - i)), i, 0, n], Sequence[0, k, 0, 30]}) → fSequence(Polygon[(i - d, 0), (i + d, 0), (i + d, Element[f, i + 1]), (i - d, Element[f, i + 1])], i, 0, n, 1) → Plotf
AI Drawing Prompt Reference
Create a dynamic binomial distribution demonstration: the horizontal axis represents the number of trials, and the vertical axis represents probability. The figure shows a series of vertical rectangular bars, each with height equal to the binomial probability mass function value, arranged adjacently with equal width to form a probability histogram. Overlaid is a smooth bell-shaped normal approximation curve, whose mean equals the product of trials and success probability, and standard deviation equals the square root of that product times the failure probability. As the number of trials increases, the histogram approaches the normal curve. Include sliders to adjust the number of trials and success probability, and text displaying parameters like mean and standard deviation.
The prompt above was compiled from the original drawing commands and is for reference only.