
Binomial and Poisson Distribution Approximation Activity
Loading the math board and drawing, please wait…
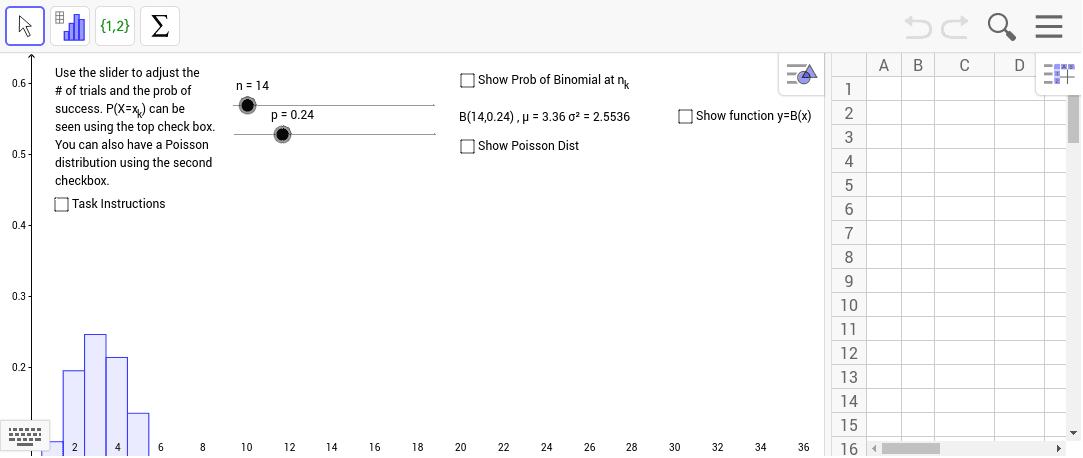
This GeoGebra activity dynamically demonstrates how the binomial distribution converges toward the Poisson distribution as its parameters change, offering a clear visual illustration of probability distribution approximation. The core mathematical concepts involved are the binomial distribution, Poisson distribution, probability mass functions, distribution convergence, and limit theory. In terms of construction, the example uses GeoGebra commands BinomialDist and Poisson to generate the respective distributions, Sequence and Element to construct sequences and extract elements, and parameter objects m, n, p, a together with list objects list1, list2, list3, list4 to control dynamic behavior. Text objects text1, text2, text3 display probability values in real time, while pic1 provides supplementary visual support. The resource is suitable for high school probability and statistics electives, introductory college probability courses, and self-directed exploration of the limit processes underlying distribution approximation.
GeoGebra Commands & Parameters
BinomialDist(n, p) → aSequence(n! / (r! * (n - r)!) * p^(r) * (1 - p)^(n - r), r, 0, n) → list1Sequence(r, r, 0, n) → list2Sequence((r, n! / (r! * (n - r)!) * p^(r) * (1 - p)^(n - r)), r, 0, n) → list3Element(list3, n_k + 1) → cSequence((r, m^(r) * ℯ^(-m) / r!), r, 0, n) → list4Element(list4, n_k + 1) → APoisson(m) → b
AI Drawing Prompt Reference
Create a dynamic probability distribution comparison chart illustrating how the binomial distribution converges to the Poisson distribution as parameters change. The chart should feature the probability mass functions of both distributions, depicted as vertical bars or discrete points, with a horizontal axis for values and a vertical axis for probabilities. Include sliders to adjust parameters n, p, and m, enabling interactive control over distribution shapes. Add real-time text labels showing probability values at specific points, and incorporate a supporting image for enhanced visual context. Use sequences to generate data points, emphasizing convergence under limit theory.
The prompt above was compiled from the original drawing commands and is for reference only.