
Betty's Quincenañera: Two Representations of a Ratio – Strip Diagram and Double
Loading the math board and drawing, please wait…
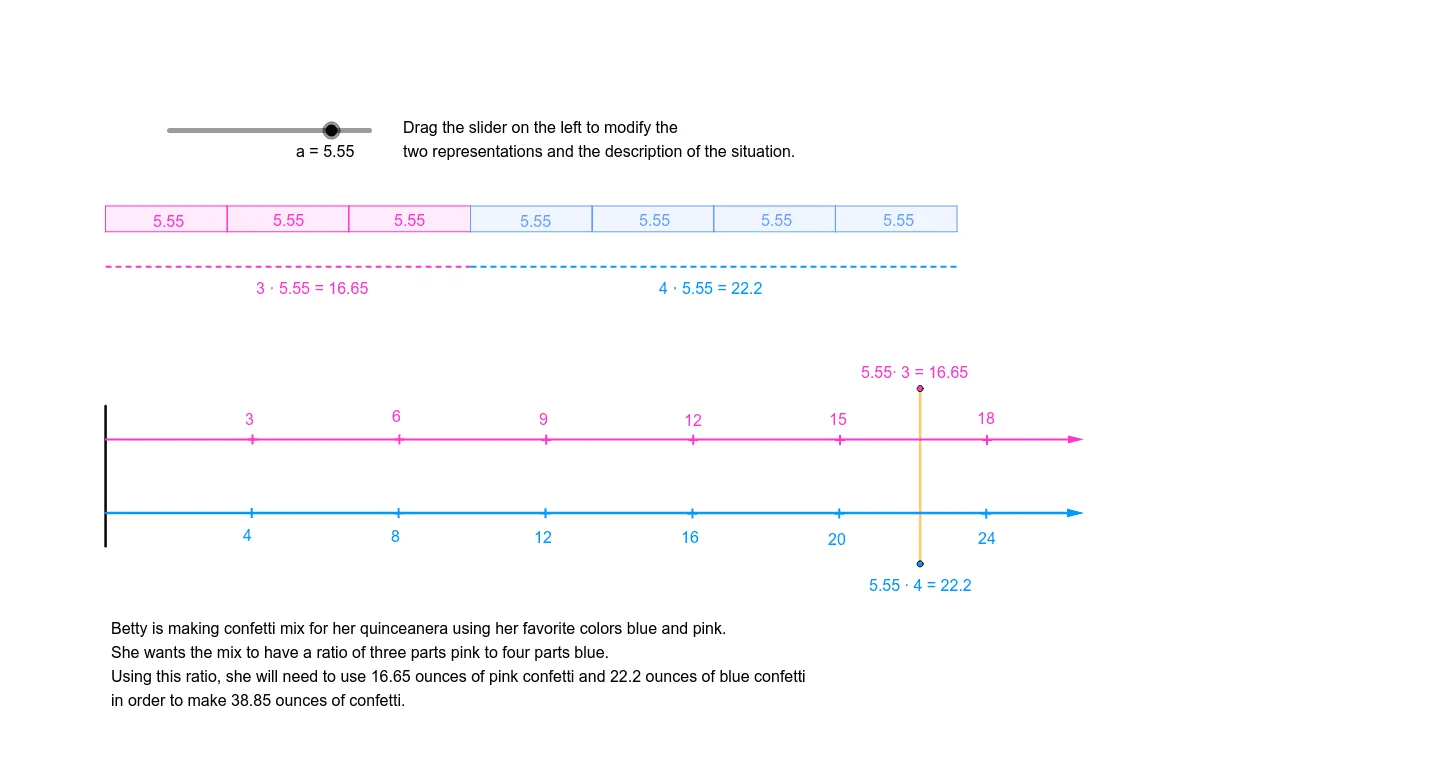
This GeoGebra example, titled 'Betty's Quincenañera', demonstrates how to represent a single ratio using two complementary visual models: a strip diagram and a double number line. The core mathematical concept is the equivalence of ratio representations, showing how a real-world context (such as quantities for a birthday celebration) can be translated into proportional lengths and aligned number scales. The construction uses a variety of GeoGebra commands including Point, Segment, Line, OrthogonalLine, Intersect, Polygon, Midpoint, Vector, Translate, Distance, and Circle to build the geometric framework. Key objects include multiple points, segments, polygons, and auxiliary lines that structure the proportional divisions. This resource is ideal for middle school students learning ratios, proportions, and percentages, as well as for teachers seeking to illustrate multiple visual strategies for the same mathematical relationship. It fosters a deeper understanding of how different diagrams can convey identical proportional information, enhancing flexibility in problem-solving.
GeoGebra Commands & Parameters
Point(Circle[A, a]) → BSegment(A, B) → fLine(C, f) → gOrthogonalLine(A, g) → hOrthogonalLine(B, g) → iIntersect(g, h) → DIntersect(g, i) → EPolygon(A, D, E, B) → poly1, a_1, d, e, bPoint(Circle[B, b]) → FSegment(B, F) → jPoint(Circle[F, b]) → GSegment(F, G) → kPoint(Circle[G, b]) → HSegment(G, H) → lPoint(Circle[H, b]) → ISegment(H, I) → mPoint(Circle[I, b]) → JSegment(I, J) → nPoint(Circle[J, b]) → KSegment(J, K) → pOrthogonalLine(F, g) → qOrthogonalLine(G, g) → rOrthogonalLine(H, g) → sOrthogonalLine(I, g) → tOrthogonalLine(J, g) → cOrthogonalLine(K, g) → f_1Intersect(g, q) → LIntersect(g, r) → MIntersect(g, s) → NIntersect(g, t) → OIntersect(g, c) → PIntersect(g, f_1) → QPolygon(B, F, L, E) → poly2, b_1, f_2, l_1, e_1Polygon(F, G, M, L) → poly3, f_3, g_1, m_1, l_2Polygon(G, H, N, M) → poly4, g_2, h_1, n_1, m_2Polygon(H, I, O, N) → poly5, h_2, i_1, o, n_2Polygon(I, J, P, O) → poly6, i_2, j_1, p_1, o_1Polygon(J, K, Q, P) → poly7, j_2, k_1, q_1, p_2Intersect(g, h) → RLine(A, R) → r_1Point(r_1) → SOrthogonalLine(S, r_1) → s_1Intersect(r, s_1) → TSegment(S, T) → t_1Intersect(f_1, s_1) → USegment(T, U) → c_1Midpoint(S, T) → VMidpoint(T, U) → WPoint(r_1) → ZPoint(r_1) → A_1Segment(Z, A_1) → d_1Point(d_1) → B_1Point(d_1) → C_1OrthogonalLine(B_1, d_1) → k_2OrthogonalLine(C_1, d_1) → q_2Point(k_2) → D_1Vector(B_1, D_1) → uPoint(q_2) → E_1Vector(C_1, E_1) → vPoint(u) → F_1OrthogonalLine(F_1, u) → r_2Point(v) → G_1Point(d_1) → H_1Vector(H_1, F_1) → wTranslate(F_1, w) → I_1Translate(I_1, w) → J_1Translate(J_1, w) → K_1Translate(K_1, w) → L_1Translate(L_1, w) → M_1Translate(G_1, w) → N_1Translate(N_1, w) → O_1Translate(O_1, w) → P_1Translate(P_1, w) → Q_1Translate(Q_1, w) → R_1Midpoint(d_1) → U_1OrthogonalLine(U_1, d_1) → t_2Point(Circle[U_1, ((a * 3) * 40.36 / 18)]) → V_1Segment(U_1, V_1) → a_2Point(d_1) → S_1Distance(S_1, R_1) → distanceS1R1Point(Circle[U_1, ((distanceS1R1 / 18 * 3) * a)]) → T_1Segment(U_1, T_1) → s_2OrthogonalLine(T_1, t_2) → b_2Circle(T_1, 4) → c_2Intersect(c_2, b_2, 2) → W_1Intersect(c_2, b_2, 1) → Z_1Segment(W_1, Z_1) → d_2
AI Drawing Prompt Reference
Draw a horizontal rectangle as a strip diagram, divided into seven equal vertical sections by equally spaced perpendicular lines from the base. Above the rectangle, construct a parallel line starting from the left endpoint, marking seven equally spaced points along it with the same unit length, and draw perpendiculars through these points to form a double number line. Then, add a slanted auxiliary line from the rectangle's left side, place a point on it, drop a perpendicular to the base, and connect the intersection points to form a small triangle, illustrating an alternative ratio representation.
The prompt above was compiled from the original drawing commands and is for reference only.