
Avery Sisco Scatter Plot with Fit Line Demo
Loading the math board and drawing, please wait…
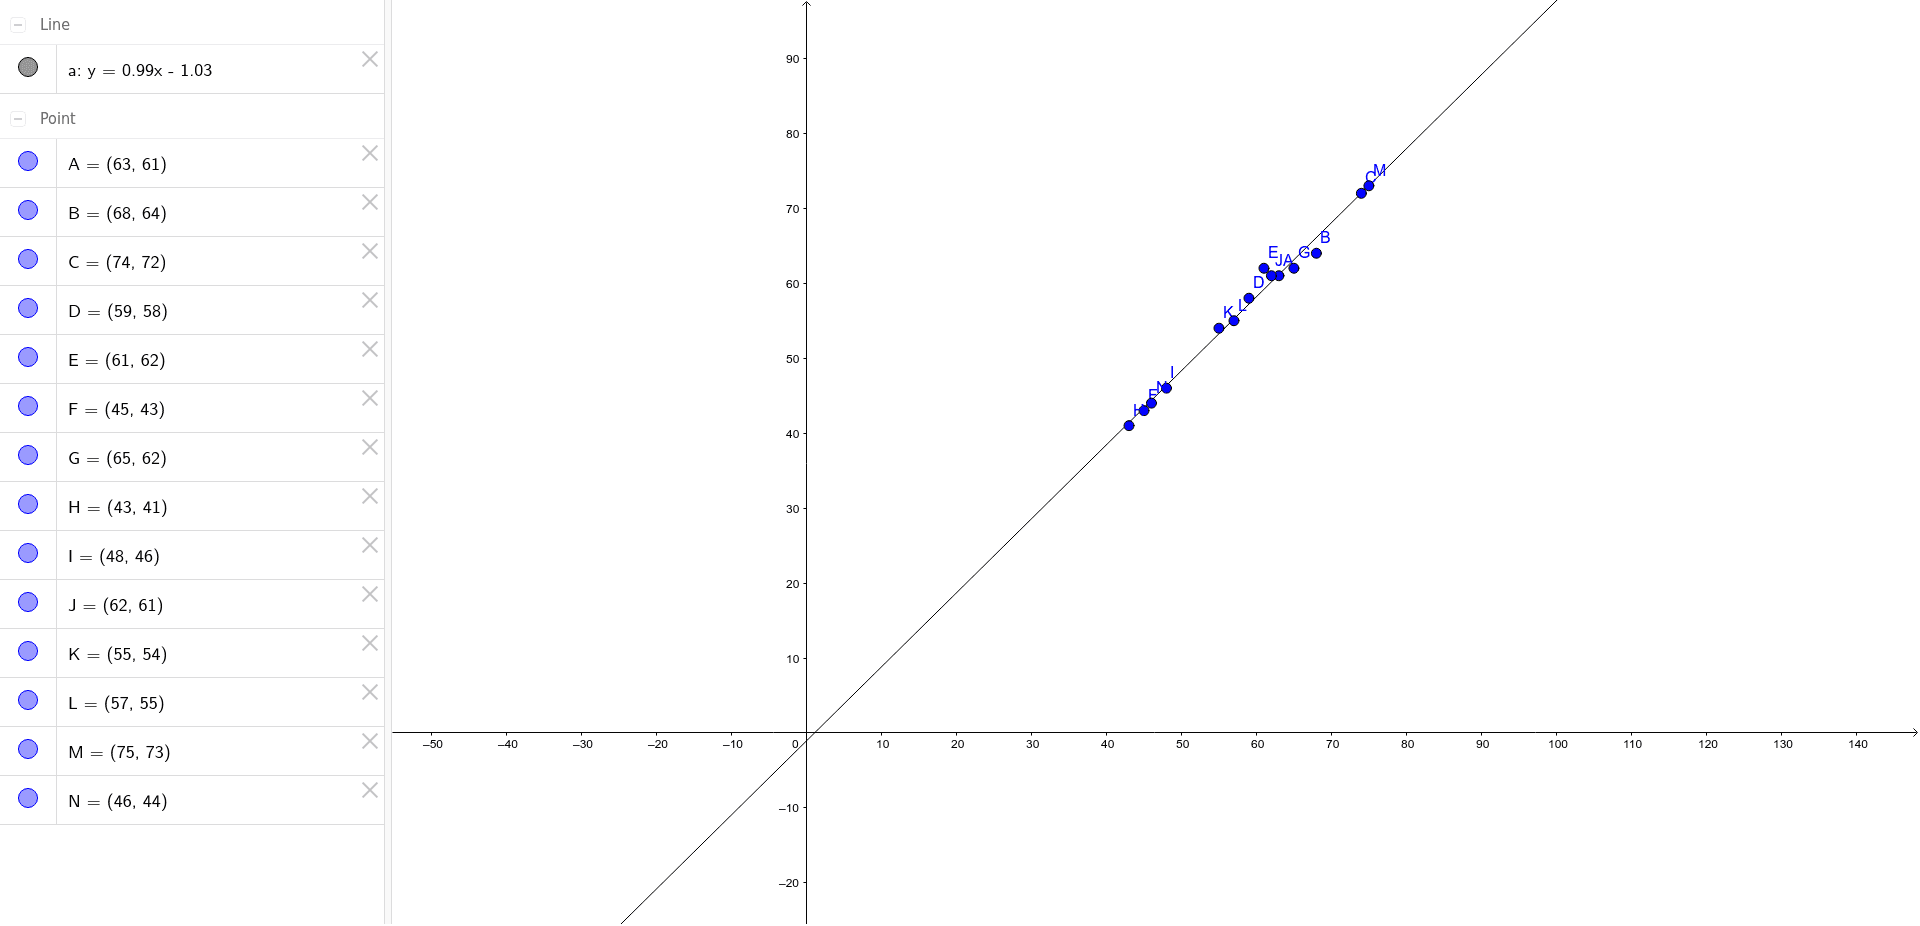
This example demonstrates how to create a scatter plot in GeoGebra and automatically generate the best‑fit line using the FitLineY command. Core mathematical concepts include scatter plots, linear regression, standard deviation, means, representation of points as complex numbers, and angle analysis. Construction highlights: the FitLineY command is applied to points A through N and the parameter a to produce the regression line. Suitable for high‑school statistics and probability courses, introductory university data‑analysis classes, and as a GeoGebra statistical graphing tutorial.
GeoGebra Commands & Parameters
FitLineY({A, B, C, D, E, F, G, H, I, J, K, L, M, N}) → a