
Average Gradient for Parabolas
Loading the math board and drawing, please wait…
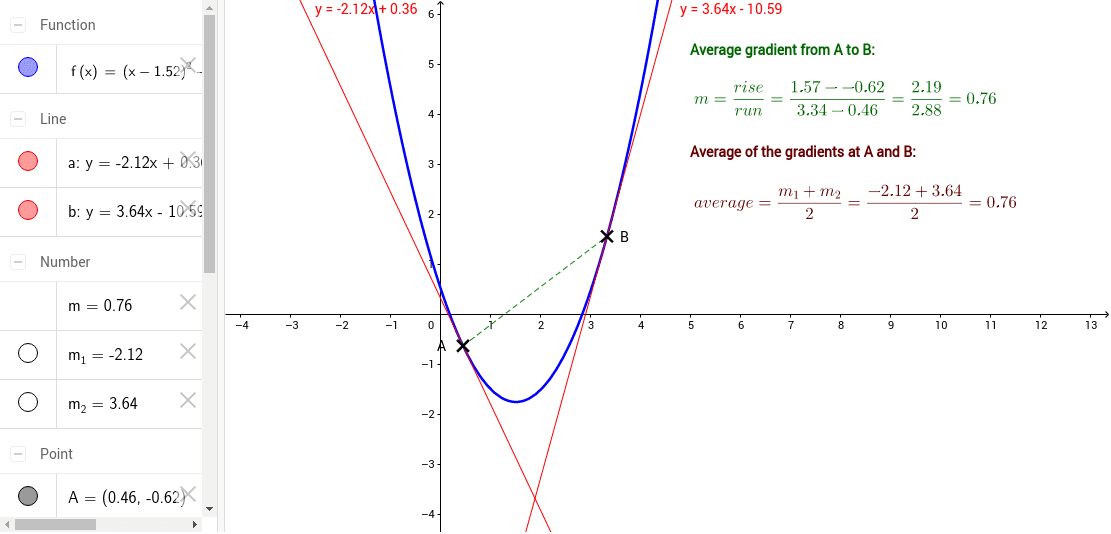
① This example shows how the average slope (secant slope) between two points on a parabola changes as the points move, illustrating the secant line approaching the tangent line. ② Core concepts include quadratic functions, the definition of the derivative, limits, and tangent slope. ③ Construction uses GeoGebra commands Point to create points A and B, Tangent to draw the tangent, Segment to join the points, and Slope to compute both secant and tangent slopes; objects comprise the function f, parameters a, b, c, text labels text1‑text4, and slope variables m, m_1, m_2. ④ Suitable for high‑school calculus introduction (Grade 11/12), university calculus preview, and interactive classroom demonstrations.
GeoGebra Commands & Parameters
Point(f) → APoint(f) → BTangent(A, f) → aTangent(B, f) → bSegment(A, B) → cSlope(a) → m_1Slope(b) → m_2
AI Drawing Prompt Reference
Draw a parabola and place two movable points on it; connect the points with a secant line and draw the tangent line at each point. Display the slope of the secant line and the slopes of both tangents, labeling all three slope values so the secant slope can be seen approaching the tangent slopes as the points move.
The prompt above was compiled from the original drawing commands and is for reference only.