
Average Deviation
Loading the math board and drawing, please wait…
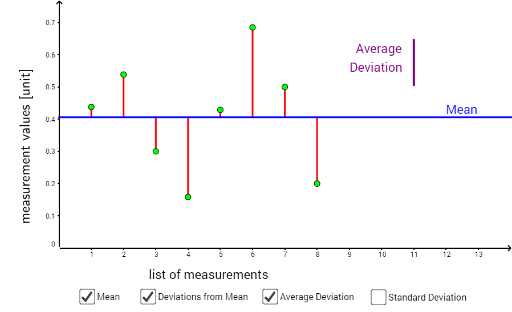
This example demonstrates the concept of average deviation. Users can change the average deviation by dragging data points. Standard deviation is also shown. Using GeoGebra commands such as Point, RotateText, Intersect, Polygon, Length, Sequence, Segment, SD, users can understand important statistical concepts. Suitable for high school mathematics education and learning.
GeoGebra Commands & Parameters
Point(x = 1) → D_1RotateText(text2, 90°) → ytitlePoint(xAxis) → AIntersect(xAxis, yAxis) → BPoint(yAxis) → CPoint(x = 2) → D_2Point(x = 3) → D_3Point(x = 4) → D_4Point(x = 5) → D_5Point(x = 6) → D_6Point(x = 7) → D_7Point(x = 8) → D_8Polygon(A, B, C, D) → poly1, a, b, c, dLength(data) → lenSequence(y(data(i)), i, 1, len) → yvalsSequence(x(data(i)), i, 1, len) → xvalsSequence(Segment[data(i), (xvals(i), avmeas)], i, 1, len) → avdevlinesSequence(abs(yvals(i) - avmeas), i, 1, len) → avdevsSegment((0, avmeas), (100, avmeas)) → avlinePolygon(E, F, G, H) → poly2, e, f, g, hSD(yvals) → stddevSegment((len + 3, avmeas + 0.1), (len + 3, avmeas + 0.1 + avdeviation)) → avdevlineSegment((len + 3.3, avmeas + 0.1), (len + 3.3, avmeas + 0.1 + stddev)) → sdevline