
Arithmetic Series Visual by Lee W Fisher
Loading the math board and drawing, please wait…
In collections
Grade 12 PreCalculus BC
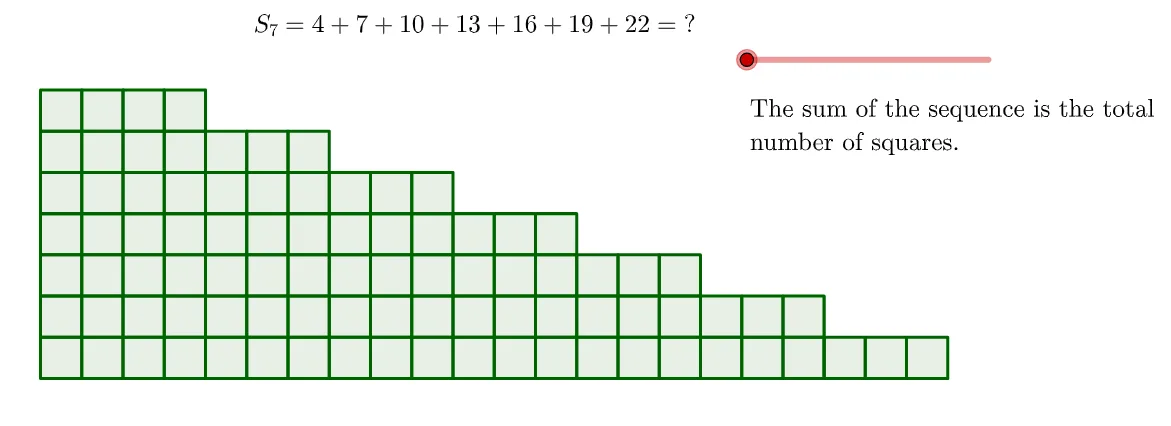
This GeoGebra example provides an interactive visual demonstration of arithmetic series, showing how the terms and partial sums can be represented geometrically. The construction uses sequences of points and polygons, with rotations and segments, to create a striking pattern that resembles a parabola or ellipse, linking algebraic sequences to geometric shapes. Core concepts include arithmetic sequences, common difference, partial sums, and the visual connection between series and conic sections. The construction employs commands such as Sequence, Polygon, Point, Rotate, and Segment, with sliders for the common difference (d) and number of rows (rows), along with multiple labeled points (P1, P2, A, B, etc.) and transformed points (A', P2', etc.) to build the symmetric arrangement. Suitable for middle and high school students exploring sequences and series, and for teachers demonstrating the geometric interpretation of arithmetic sums in a dynamic, inquiry-based setting.
GeoGebra Commands & Parameters
Sequence(Sequence[Polygon[(n, m), (n + 1, m), 4], n, 1, last - (m * d)], m, 4, rows) → l1Polygon(P1, P2, P3, P4) → q1, p1, p2, p3, p4Point(p2) → APoint(l1) → BPoint(l1) → CPoint(l1) → DPoint(l1) → EPoint(l1) → FPoint(l1) → GRotate(A, an, RP) → A'Rotate(P2, an, RP) → P2'Rotate(B, an, RP) → B'Rotate(C, an, RP) → C'Rotate(D, an, RP) → D'Rotate(E, an, RP) → E'Rotate(F, an, RP) → F'Rotate(G, an, RP) → G'Sequence(Sequence[Polygon[(n, m), (n + 1, m), 4], n, 14, last - (m * d)], m, 1, 3) → l2Rotate(l2, an, RP) → l2'Sequence(Sequence[Polygon[(n, m), (n + 1, m), 4], n, 1, 13], m, 1, 3) → l3Point(l1) → HPoint(l2') → ISegment(P4, H) → fSegment(P1, P5) → gSequence(Polygon[(n, 1), (n + 1, 1), 4], n, 1, 22) → l4Sequence(Polygon[(n, 7), (n + 1, 7), 4], n, 1, 4) → l5
AI Drawing Prompt Reference
Draw a geometric visualization of an arithmetic series featuring a symmetric pattern of square grids arranged in tilted rows from upper-left to lower-right, with grid density gradually changing and forming a parabolic or elliptical curve shape. Include multiple rotationally symmetric structures mirrored around a center point. Connect some vertices with line segments to create intersecting grid lines. Include a slider at the bottom controlling the common difference value and another slider on the right controlling the number of rows, allowing the shape and density of the pattern to change dynamically. The overall effect combines mathematical sequences with geometric beauty.
The prompt above was compiled from the original drawing commands and is for reference only.