
Area under curve using Geometric Probability
Loading the math board and drawing, please wait…
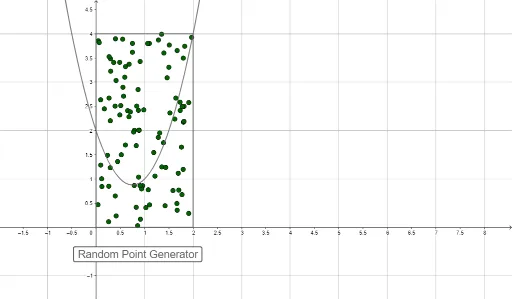
This example demonstrates how to calculate the area under a curve using GeoGebra, showcasing the relationship through geometric probability. Core math concepts include area, probability, ratios, rational numbers, line segments, translation, exponential functions, and bar charts. The construction leverages GeoGebra commands Polygon and Sequence, along with objects like c, f, f_2, f_3, f_4, f_5, l1, button1, and button2. It is suitable for high school mathematics education, illustrating the integration of calculus and probability & statistics.
GeoGebra Commands & Parameters
Polygon((0, 0), (0, 4), (2, 4), (2, 0)) → f, f_2, f_3, f_4, f_5Sequence(RandomPointIn[f], a, 1, 100) → l1
AI Drawing Prompt Reference
Draw a rectangle starting from the origin with a height of 4 and a width of 2, then generate 100 random points inside this rectangle to calculate the area under the curve.
The prompt above was compiled from the original drawing commands and is for reference only.