
Area Under a Function: Riemann, Trapezoid, Integral
Loading the math board and drawing, please wait…
In collections
Rate & Accumulation Yr 4 Much&Fast
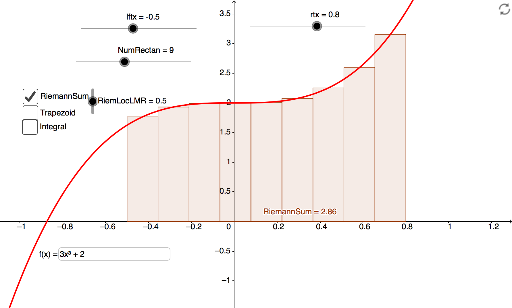
This example demonstrates how to calculate the area under a function's curve using Riemann sums, trapezoidal sums, and definite integrals. Key math concepts include Riemann sums, trapezoidal approximation, integral calculus, and function graphing. It is constructed using GeoGebra commands like Integral, TrapezoidalSum, RectangleSum, and Textfield, with parameters a, b, c, lftx, rtx. Suitable for high school and above students learning calculus, helping them visualize and compare different integration methods.
GeoGebra Commands & Parameters
Integral(f, lftx, rtx) → IntegralTrapezoidalSum(f, lftx, rtx, NumRectan) → TrapezoidRectangleSum(f, lftx, rtx, NumRectan, RiemLocLMR) → RiemannSumTextfield(f) → InputBox1
AI Drawing Prompt Reference
Draw a function graph and below it, represent the area under the curve in an interval using three methods: Riemann sum with rectangles, trapezoidal sum with trapezoids, and definite integral with a shaded area, all displayed side by side for comparison.
The prompt above was compiled from the original drawing commands and is for reference only.