
Area of a Rectangle as a Function of x
Loading the math board and drawing, please wait…
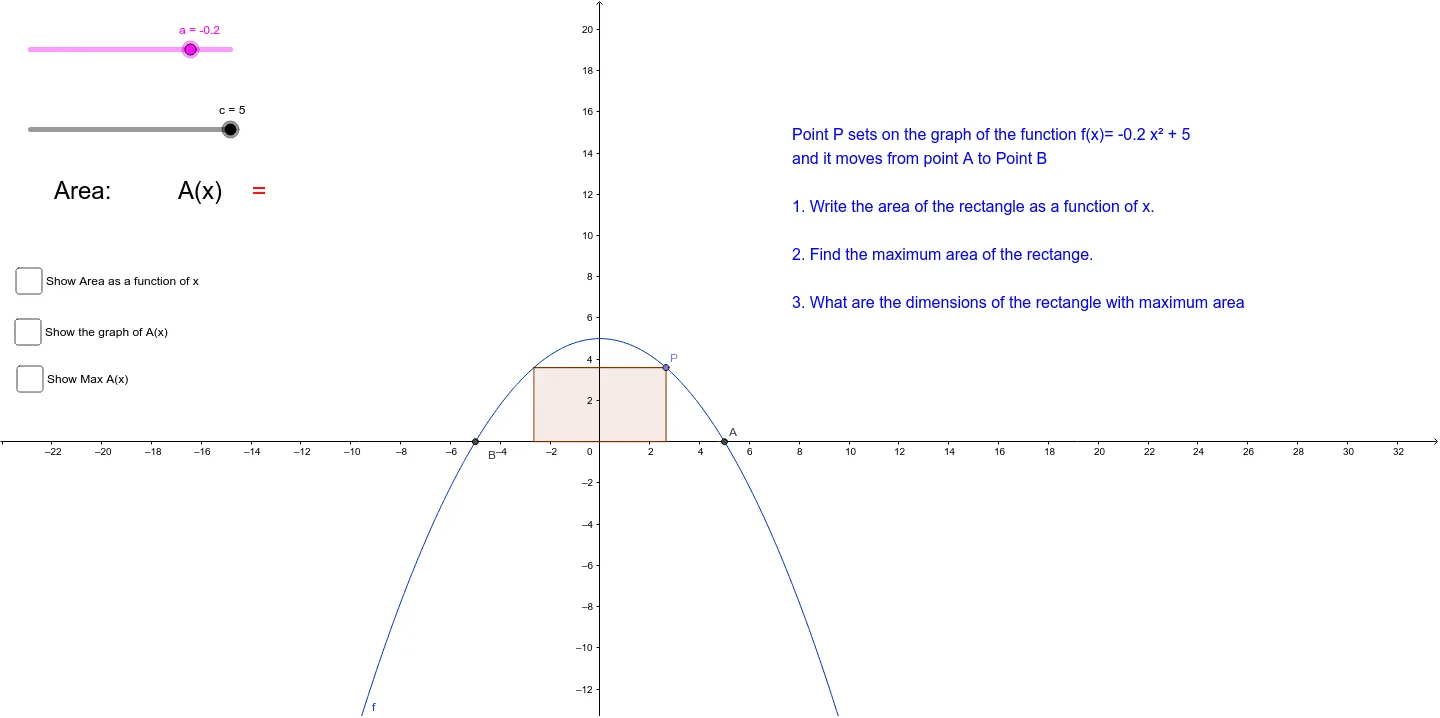
This example demonstrates how the area of a rectangle changes as one of its sides, x, varies. Key math concepts include functions, area calculation, and coordinate geometry. It is constructed using GeoGebra commands like Roots, Point, Line, OrthogonalLine, Intersect, Mirror, Segment, Polygon, Max. Suitable for high school mathematics education to understand the relationship between functions and geometric shapes, and the application of parametric equations.
GeoGebra Commands & Parameters
Roots(f, -6, 20) → B, APoint(f) → PLine(P, xAxis) → dOrthogonalLine(P, xAxis) → eOrthogonalLine(P, xAxis) → iIntersect(i, xAxis) → JMirror(P, yAxis) → P'OrthogonalLine(P, xAxis) → hOrthogonalLine(P', xAxis) → jSegment(P, P') → kIntersect(j, xAxis) → CIntersect(h, xAxis) → DPolygon(P, D, C, P') → poly1, p, d_1, c_1, p'Max(g, 0, x(A)) → E
AI Drawing Prompt Reference
On a coordinate plane, draw the x-axis and y-axis. Let a function f(x) be given, and take its two intersection points with the x-range to define points A and B. For a variable point P on the curve, drop perpendiculars to the x-axis through P to get an intersection point C, and use the mirror of P across the y-axis, P′, to drop a perpendicular to the x-axis and obtain intersection point D. Connect P and P′ and form a rectangle (a polygon) using the corners determined by P, P′, C, and D, so the rectangle changes as x varies. Include a quantity E to represent the rectangle’s area value as a function of x.
The prompt above was compiled from the original drawing commands and is for reference only.