
Area Between Curves Rotated Around Y-Axis
Loading the math board and drawing, please wait…
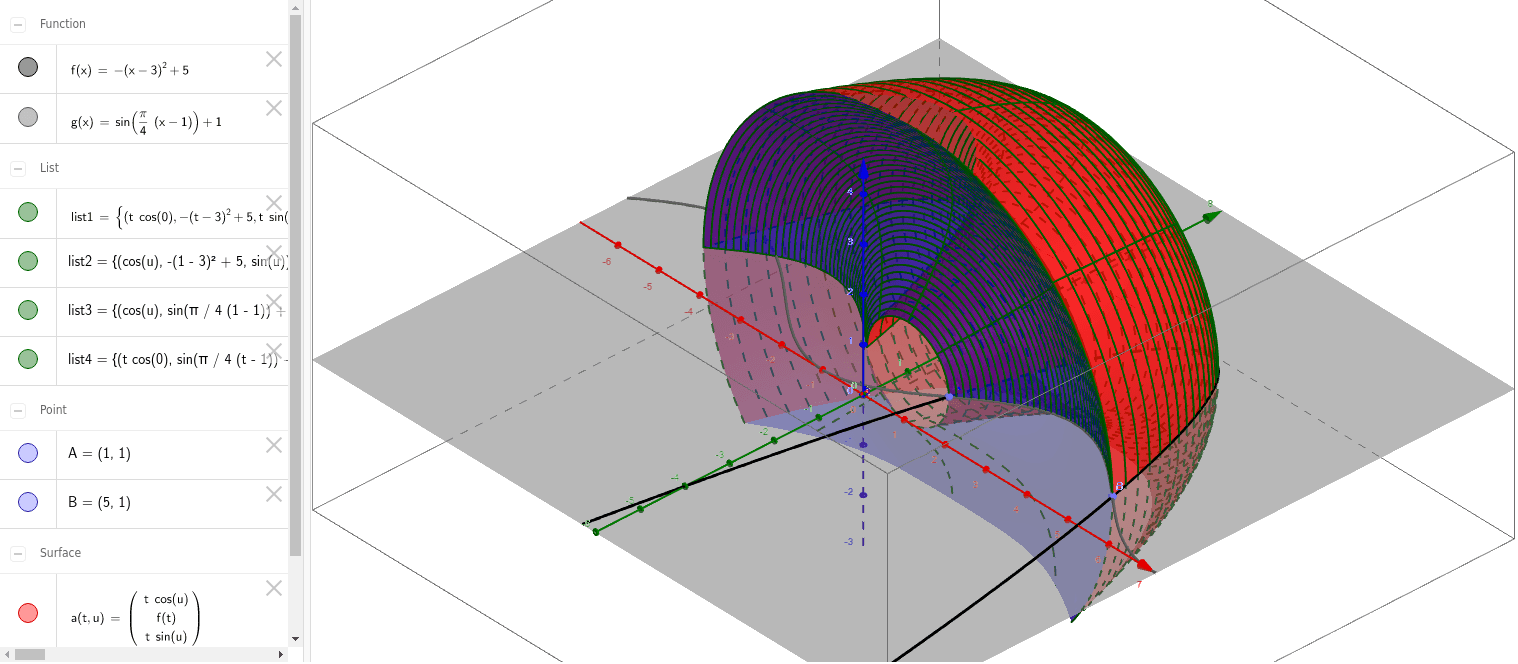
This example demonstrates the solid formed by rotating the area between two curves around the y-axis. Key mathematical concepts include the area between curves and solid geometry. It uses GeoGebra commands such as Point, Surface, and Sequence. Suitable for high school math education to help students understand the concept of solid geometry through rotation.
GeoGebra Commands & Parameters
Point(f) → APoint(g) → BSurface((t * cos(u)), f(t), (t * sin(u)), t, x(A), x(B), u, 0, 6.283185307179586) → aSequence(CurveCartesian[(t * cos(u)), f(t), (t * sin(u)), t, x(A), x(B)], u, 0, 6.283185307179586, 0.7853981633974483) → list1Sequence(CurveCartesian[(t * cos(u)), f(t), (t * sin(u)), u, 0, 6.28319], t, x(A), x(B), 0.1) → list2Surface((t * cos(u)), g(t), (t * sin(u)), t, x(A), x(B), u, 0, 6.28319) → bSequence(CurveCartesian[(t * cos(u)), g(t), (t * sin(u)), u, 0, 3.141592653589793], t, x(A), x(B), 0.1) → list3Sequence(CurveCartesian[(t * cos(u)), g(t), (t * sin(u)), t, x(A), x(B)], u, 0, 6.283185307179586, 0.7853981633974483) → list4
AI Drawing Prompt Reference
Draw the solid formed by rotating the area between two curves around the y-axis. First, plot two curves f(x) and g(x). Then, rotate the area between these two curves around the y-axis to form a solid. Finally, display the surface of the solid and show cross-sections at different angles and steps.
The prompt above was compiled from the original drawing commands and is for reference only.