
Area Between Curves Rotated Around x-Axis
Loading the math board and drawing, please wait…
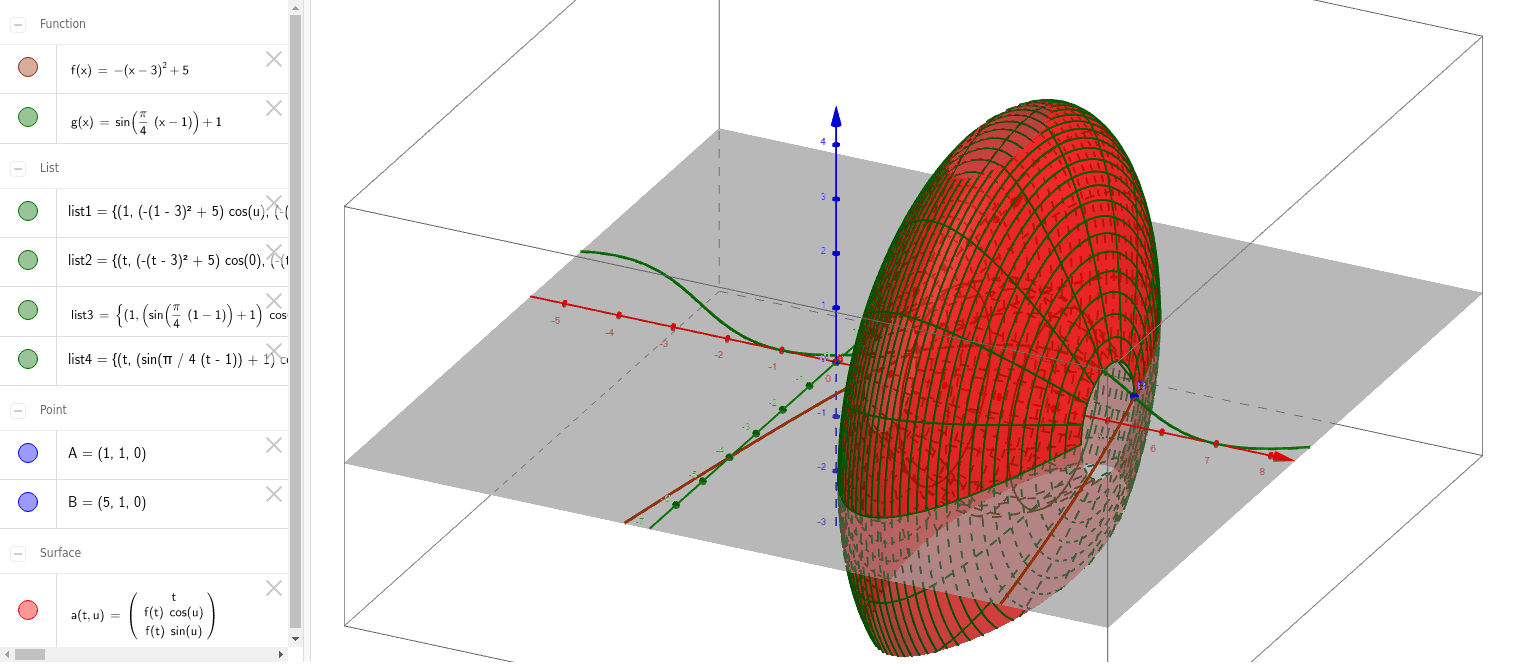
This example demonstrates the solid formed by rotating the area between two curves around the x-axis. Key mathematical concepts include functions, integration, and solid geometry. The Surface command is used to construct the solid. Suitable for high school and above students to learn about the volume of solids of revolution.
GeoGebra Commands & Parameters
Surface(t, (f(t) * cos(u)), (f(t) * sin(u)), t, x(A), x(B), u, 0, 6.283185307179586) → aSequence(CurveCartesian[t, (g(t) * cos(u)), (g(t) * sin(u)), u, 0, 25.13274], t, x(A), x(B)) → list3Sequence(CurveCartesian[t, (f(t) * cos(u)), (f(t) * sin(u)), u, 0, 6.28319], t, x(A), x(B), 0.1) → list1Sequence(CurveCartesian[t, (f(t) * cos(u)), (f(t) * sin(u)), t, x(A), x(B)], u, 0, 6.28319, 0.3490658503988659) → list2Sequence(CurveCartesian[t, (g(t) * cos(u)), (g(t) * sin(u)), t, x(A), x(B)], u, 0, 6.283185307179586, 0.3490658503988659) → list4
AI Drawing Prompt Reference
Draw the solid obtained by rotating the region between the curves f(x) and g(x) from x = A to x = B around the x‑axis. Show the outer surface generated by f(x) and the inner hollow surface generated by g(x), together with a set of circular cross‑sections and longitudinal grid lines that reveal the three‑dimensional shape of the solid of revolution.
The prompt above was compiled from the original drawing commands and is for reference only.