
Area Between Curves Demo
Loading the math board and drawing, please wait…
In collections
BC Calculus
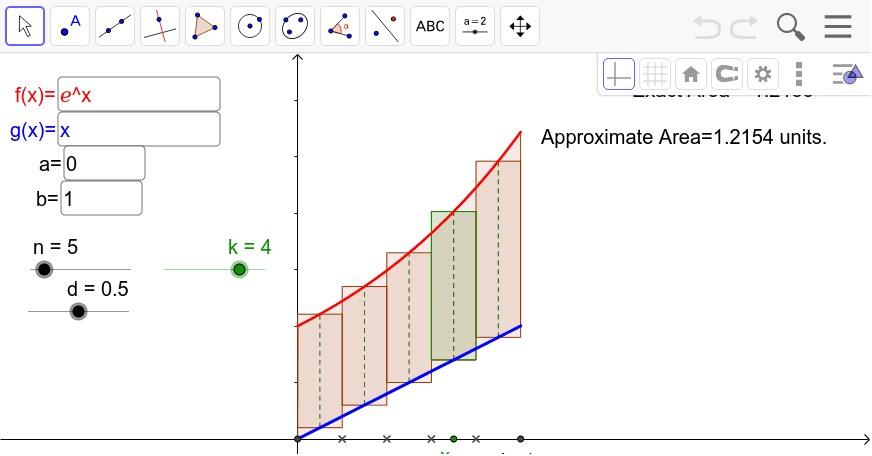
This example demonstrates the calculation of the area between two curves by visualizing the limit of Riemann sums. It involves core math concepts like integration, limits, function graphs, and coordinate geometry. Constructed using GeoGebra commands such as Textfield, Function, IntegralBetween, Sequence, Element, Integral, and sliders, it is suitable for high school and above, particularly in calculus education to intuitively understand the geometric meaning of definite integrals.
GeoGebra Commands & Parameters
Textfield(f) → inputBox1Textfield(g) → inputBox2Textfield(a) → inputBox3Textfield(b) → inputBox4Function(f, a, b) → hFunction(g, a, b) → pIntegralBetween(f, g, a, b) → cSequence(a + (k - 1 + d) * dx, k, 1, n) → xxSequence(Polygon[(a + (k - 1) * dx, g(Element[xx, k])), (a + k * dx, g(Element[xx, k])), (a + k * dx, f(Element[xx, k])), (a + (k - 1) * dx, f(Element[xx, k]))], k, 1, n) → rectsSequence(Segment[(Element[xx, k], g(Element[xx, k])), (Element[xx, k], f(Element[xx, k]))], k, 1, n) → list2Element(rects, k) → poly1Integral(abs(f(x) - g(x)), a, b) → eSequence((x(A) + i * dx, 0), i, 1, n - 1) → list1
AI Drawing Prompt Reference
Draw the area between two functions f(x) and g(x) within the interval [a, b]. First, input the expressions for f(x) and g(x), and the interval endpoints a and b. Then, plot the graphs of these functions and calculate the area between them. Next, visualize the limit of Riemann sums by drawing a series of rectangles with their bases on the x-axis and heights equal to the difference between the two functions at each point. Finally, display the calculated area value.
The prompt above was compiled from the original drawing commands and is for reference only.