
Area and Perimeter of Rectangles: Exploring Change with Dimensions
Loading the math board and drawing, please wait…
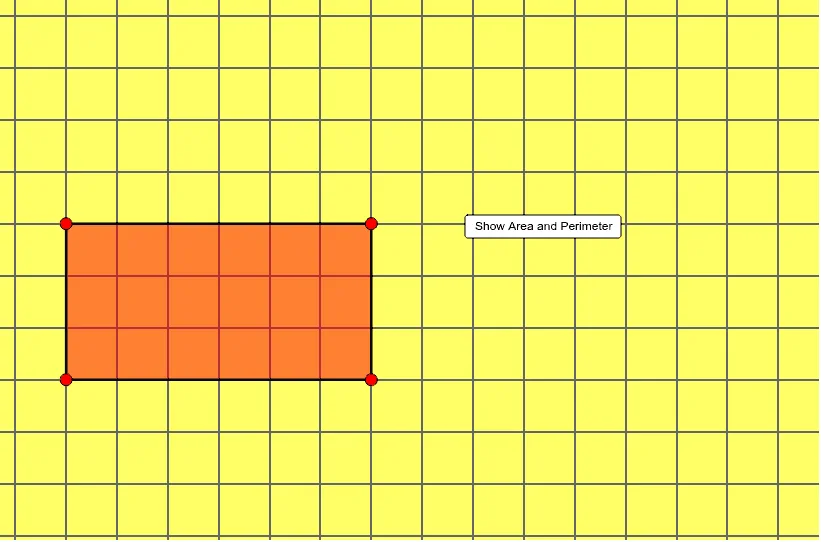
This GeoGebra example demonstrates how a rectangle’s area and perimeter change as its side lengths vary, using dynamic geometric visualization. It focuses on core ideas such as the area and perimeter of rectangles, modeling relationships with functions (e.g., power/exponential-style dependencies when parameterized), and using graphical comparison connected to integral-calculus thinking. Construction uses Polygon and Segment to build rectangle shapes (with vertices like A, B, C, D and corresponding objects poly1 and poly2), and employs an Area object to compute/display the resulting area values. Additional point/edge objects (a, b, c, d, e, f, g, h, E, F, G, H) and text/annotation elements (text1) support clear labeling of measurements. Interactive components like button1/button2 and a parameter control (e.g., ymax) enable switching or updating configurations so learners can observe trends between geometry and quantitative measures. Suitable for classroom demonstrations in middle school through early college, especially for connecting geometry with function modeling and introductory calculus concepts.
GeoGebra Commands & Parameters
Polygon(A, B, C, D) → poly1, a, b, c, dSegment(A, B) → eSegment(B, C) → fSegment(C, D) → gSegment(D, A) → hPolygon(E, F, G, H) → poly2, e_1, f_1, g_1, h_1
AI Drawing Prompt Reference
Draw a rectangle with vertices A, B, C, D and corresponding side segments e, f, g, h. The rectangle can have dynamic area and side lengths. Another rectangle E, F, G, H is also included, along with labeling text. Adjusting parameters allows observing changes in area and side lengths, suitable for teaching geometry and function relationships.
The prompt above was compiled from the original drawing commands and is for reference only.