
Area and Perimeter of Rectangles Dynamic Demonstration
Loading the math board and drawing, please wait…
In collections
Area and Perimeter of Rectangles
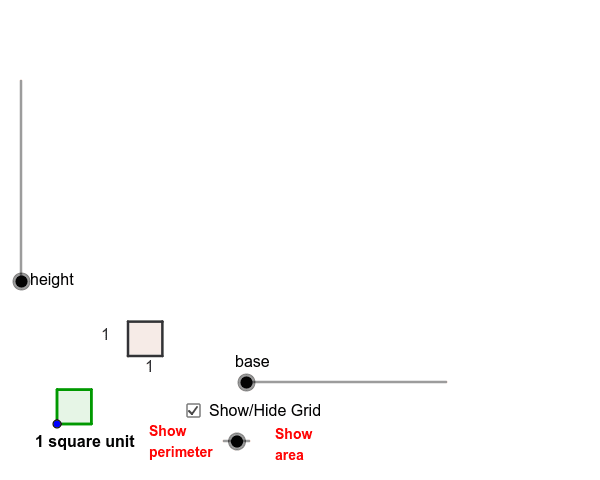
This GeoGebra example demonstrates the dynamic relationship between the area and perimeter of rectangles as their base and height change. The core mathematical concepts involved include the rectangle area formula, perimeter formula, dimensional scaling, and geometric measurement. The construction employs GeoGebra commands such as Sequence, Polygon, Circle, and Point, together with objects including unitsize, base, height, points A through E, lists list1 through list4, polygons poly1 and poly2, variables a through k, dotted horizontal and vertical lines, text labels text1 through text11, and a chooser slider. By combining points, polygons, dashed grid lines, and dynamic text annotations, the example enables interactive visualization of how varying side lengths affects both area and perimeter simultaneously. It is suitable for middle school geometry instruction, classroom demonstrations, and independent student exploration of area and perimeter concepts.
GeoGebra Commands & Parameters
Sequence((x(A) + unitsize * i, y(A)), i, 1, base) → list1Sequence((x(A) + unitsize * i, y(A) + height * unitsize), i, 1, base) → list2Sequence((x(A), y(A) + unitsize * i), i, 1, height) → list3Sequence((x(A) + base, y(A) + unitsize * i), i, 1, height) → list4Polygon(A, Element[list1, base], Element[list2, base], Element[list3, height]) → poly1, a, b, c, dCircle(B, unitsize) → fPoint(f) → CCircle(C, unitsize) → gPolygon(B, C, 4) → poly2, h, i, j, k, D, ESequence(Segment[(x(A), y(A) + unitsize * i), (x(A) + base * unitsize, y(A) + unitsize * i)], i, 0, height) → dottedhorizontalsSequence(Segment[(x(A) + unitsize * i, y(A)), (x(A) + unitsize * i, y(A) + height * unitsize)], i, 0, base) → dottedverticals
AI Drawing Prompt Reference
Draw a dynamic rectangle with adjustable base and height, filled with a dashed grid of unit squares. The rectangle's bottom-left corner is fixed, with base and height controlled by sliders. Grid lines run horizontally and vertically at unit intervals. The rectangle has a solid border, with area and perimeter values displayed as text. Beside it, place a small unit square for reference. Include coordinate axes, grid, rectangle, square, and dynamic labels to show how area and perimeter change with dimensions.
The prompt above was compiled from the original drawing commands and is for reference only.