
Approximating a Curve’s Area with Rectangles
Loading the math board and drawing, please wait…
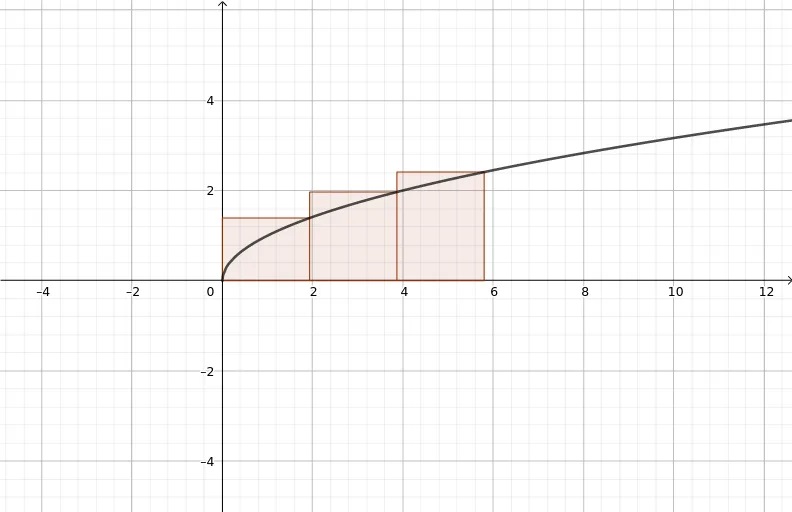
This example visualizes area approximation by placing rectangles under a curve and summing their areas for different partition counts. It highlights the convergence behavior: as the number of subintervals n increases, the rectangle-sum approaches the true area. The core mathematics are function evaluation, Riemann-sum intuition, and the link to definite integrals (approximating an integral by rectangle sums). Construction in GeoGebra centers on using the RectangleSum command to compute the sum, while Textfield and LaTeX are used to display key parameters and computed results (such as n, the function f, and the running sum rs). An InputBox (InputBox1) provides interactive control of inputs, and multiple text objects (text1–text5, ntext, etc.) are used to label the plot clearly. Suitable for calculus introductory lessons, especially when teaching the geometric meaning of integration and numerical/graphical approximation ideas.
GeoGebra Commands & Parameters
Textfield(f) → InputBox1RectangleSum(f, a, b, n, 1) → rsLaTeX("Area \approx f(x_{1}) \Delta x + f(x_{2}) \Delta x + f(x_{3}) \Delta x ") → ntext
AI Drawing Prompt Reference
Draw a function curve and approximate the area under it using a series of rectangles. The number of rectangles is controlled by a slider; as the slider increases, more rectangles appear and the total area approaches the true area under the curve. Display the function expression, the current rectangle count, and the accumulated approximate area. Include a text label showing the area approximation formula with terms like f(x1)Δx + f(x2)Δx + f(x3)Δx. The visual should clearly illustrate the Riemann sum concept for calculus.
The prompt above was compiled from the original drawing commands and is for reference only.