
Applications of Arithmetic with Powers of 10: Interactive Inputs and Displayed R
Loading the math board and drawing, please wait…
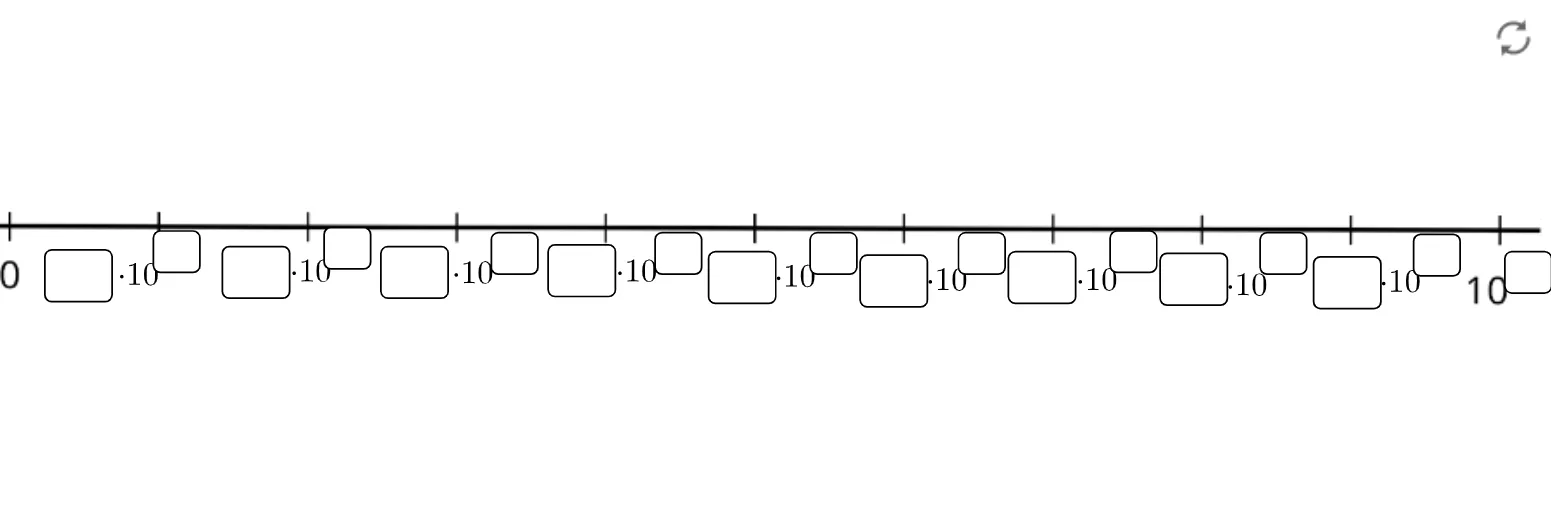
This example demonstrates how to apply arithmetic operations using powers of 10, showing the computed outcomes and intermediate reasoning steps with interactive on-screen annotations. The key mathematical ideas include place-value thinking, how decimal shifts correspond to multiplying/dividing by 10^n, representing and connecting rational numbers and percentages, and (when relevant) using numeric normalization or summarized values for clear comparison. Construction-wise, it is built around GeoGebra’s Textfield for dynamic text output and a set of multiple InputBox controls to let users enter parameters for exponents and operands; the results are then placed onto the canvas using several text objects (text1–text9). The construction summary indicates the use of objects such as A, B, and pic1 together with InputBox1–InputBox19, where the text objects update to reflect the current arithmetic with powers of 10. Suitable for middle-school math lessons and interactive classroom demonstrations focused on exponents, percent conversion, and numeric reasoning.
GeoGebra Commands & Parameters
Textfield() → InputBox1Textfield() → InputBox2Textfield() → InputBox3Textfield() → InputBox4Textfield() → InputBox5Textfield() → InputBox6Textfield() → InputBox7Textfield() → InputBox8Textfield() → InputBox9Textfield() → InputBox10Textfield() → InputBox11Textfield() → InputBox12Textfield() → InputBox13Textfield() → InputBox14Textfield() → InputBox15Textfield() → InputBox16Textfield() → InputBox17Textfield() → InputBox18Textfield() → InputBox19
AI Drawing Prompt Reference
Create an interactive instructional canvas for demonstrating arithmetic with powers of ten. Arrange nineteen blank input boxes in a neat grid, each paired with a dynamic text label that updates to show the entered exponent, operand, or computed result. Organize the layout into three columns: left column for entering exponents of ten, middle column for entering numeric operands, and right column for displaying outcomes such as products, quotients, percentage conversions, and scientific notation. Place a prominent central text area that shows the current calculation step, for example, '10 to the power of 3 times 0.025 equals 25'. Use a light grid background for alignment, and keep the overall style clean and suitable for classroom projection.
The prompt above was compiled from the original drawing commands and is for reference only.