
Animated Unit Circle Tangent Curve
Loading the math board and drawing, please wait…
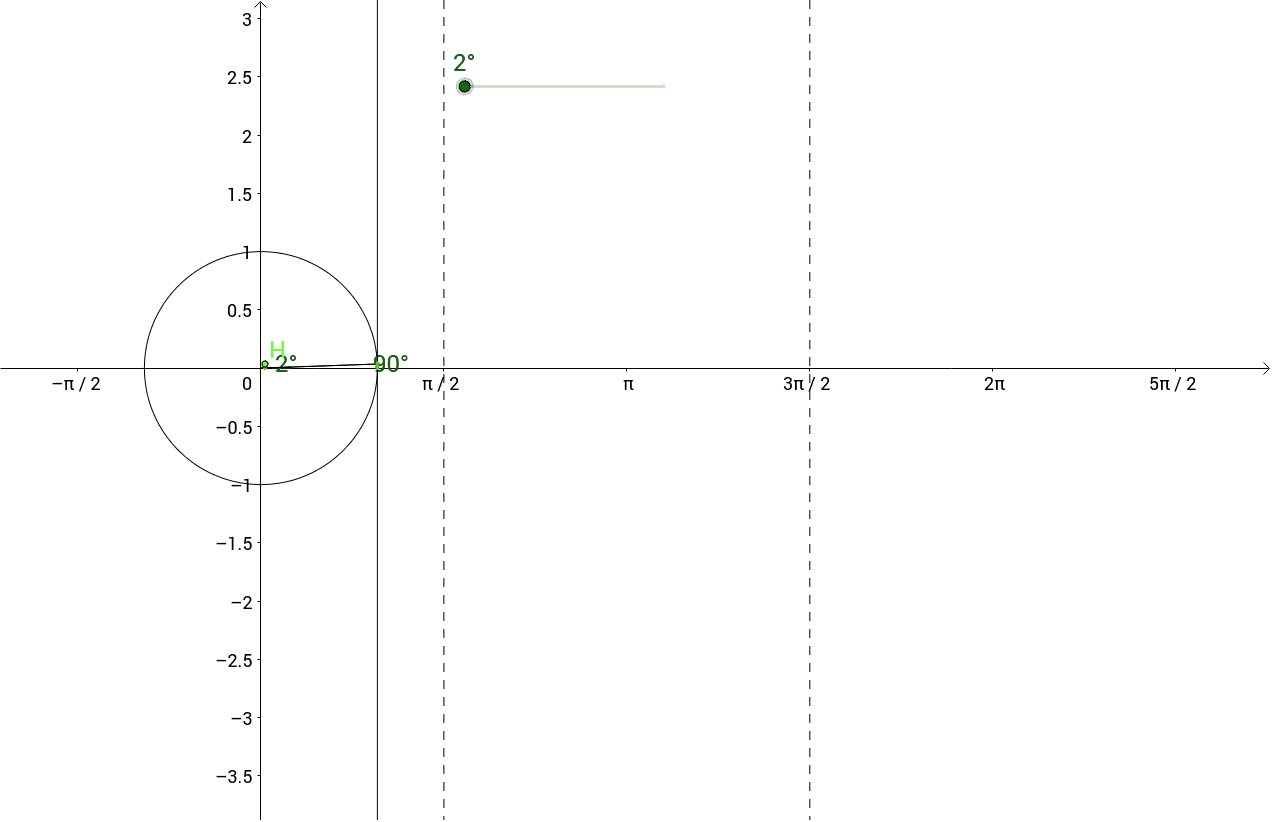
This example demonstrates the dynamic relationship between the tangent function graph and the unit circle, showing how the tangent curve is derived. Key math concepts include the unit circle, trigonometric functions, tangent lines, and angle rotations. GeoGebra commands used in construction are Point, Rotate, Angle, Segment, Line, and Intersect. It is suitable for high school mathematics education, providing an intuitive understanding of the generation process of trigonometric function graphs and tangent properties.
GeoGebra Commands & Parameters
Point(c) → APoint(xAxis) → BRotate(A, a, B) → A'Angle(A, B, A') → αSegment(D, C) → bSegment(E, A') → dSegment(B, E) → eSegment(B, A') → fSegment(F, C) → gLine(A', B) → iIntersect(i, h) → GSegment(B, G) → jSegment(G, A) → kAngle(G, A, B) → βSegment(H, C) → n
AI Drawing Prompt Reference
Create an animated diagram showing the relationship between the unit circle and the tangent function. Draw a unit circle centered at the origin with its horizontal diameter along the x-axis. Place a point on the circle and connect it to the center with a radius, displaying the angle from the positive x-axis. Construct a tangent line at this point, intersecting a vertical reference line. From the intersection, drop a perpendicular to the x-axis, creating a segment whose length represents the tangent value. On a separate coordinate plane to the right, plot the angle on the x-axis and the tangent value on the y-axis, tracing the tangent curve as the point rotates. Ensure the circle, tangent line, and curve update dynamically together.
The prompt above was compiled from the original drawing commands and is for reference only.