
Analysis of Accurate Passes in 2011 Champions League Final
Loading the math board and drawing, please wait…
In collections
How to (3): Commands, Spreadsheets and Statistics
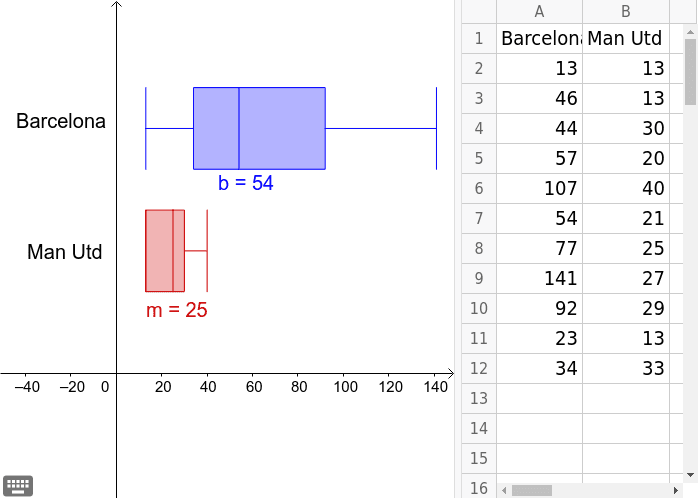
This example analyzes the accurate passes in the 2011 Champions League final, demonstrating box plots and pie charts in statistics. Using GeoGebra commands BoxPlot and Text, the statistical analysis of pass data is constructed. Suitable for high school mathematics education, particularly in statistics and probability & statistics.
GeoGebra Commands & Parameters
BoxPlot(1, 0.3333333333333333, {B2, B3, B4, B5, B6, B7, B8, B9, B10, B11, B12}, true) → mBoxPlot(2, 0.3333333333333333, {A2, A3, A4, A5, A6, A7, A8, A9, A10, A11, A12}, true) → bText(" Man Utd ") → text1Text(" Barcelona ") → text2