
Amplitude Change- Sine Function
Loading the math board and drawing, please wait…
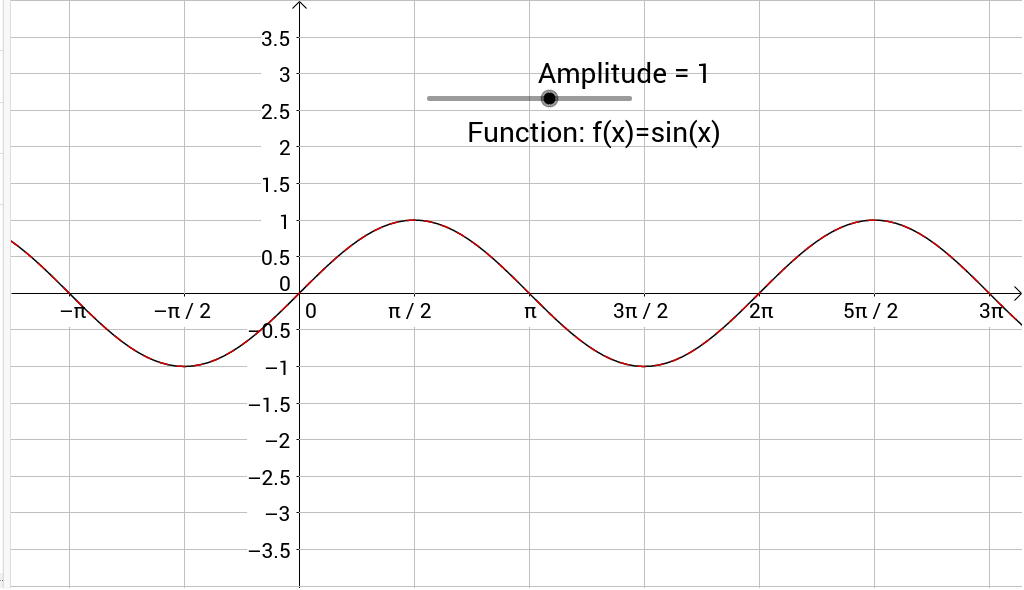
This example demonstrates the graphical phenomenon of amplitude change in sine functions. Key math concepts include sine function, amplitude, and coordinate system. It utilizes GeoGebra commands/objects like f (function), Amplitude (amplitude parameter), g (function graph), and text1 (text label). Suitable for high school students learning trigonometric functions or for teaching function graph transformations.
GeoGebra Commands & Parameters
f(x) = sin(x)Numeric Amplitude(1)g(x) = (Amplitude * sin(x))
AI Drawing Prompt Reference
Draw a sine function graph and demonstrate the effect of amplitude change. First plot the standard sine curve, then add an adjustable amplitude parameter and use it to multiply the sine function to generate a new sine curve whose amplitude changes with the parameter. Label the two functions in the graph and indicate the effect of the amplitude parameter on the shape.
The prompt above was compiled from the original drawing commands and is for reference only.