
Algebraic Division Demo
Loading the math board and drawing, please wait…
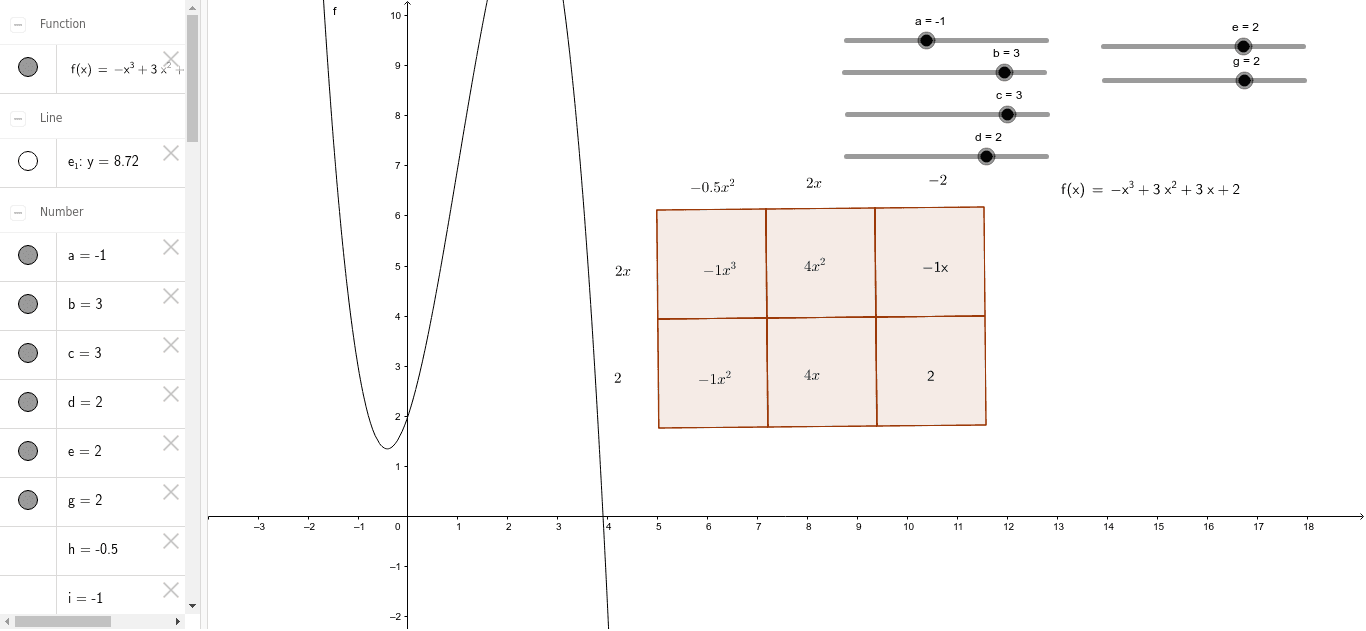
This example demonstrates the process and result of algebraic division, involving polynomial operations, remainder theorem, and factorization. It uses Polygon, Textfield, and LaTeX commands to visualize polynomials and their division, with objects like a, b, c, d, f representing coefficients and poly1 series for polynomial graphs. Suitable for high school mathematics teaching to help students understand polynomial division algorithms and geometric interpretations.
GeoGebra Commands & Parameters
Polygon(A_6, B_6, 4) → poly1_1, a_1, b_1, c_1, d_1, C_6, D_6Polygon(A_5, B_5, 4) → poly1_2, a_2, b_2, c_2, d_2, C_5, D_5Polygon(A_4, B_4, 4) → poly1_3, a_3, b_3, c_3, d_3, C_4, D_4Polygon(A_3, B_3, 4) → poly1_4, a_4, b_4, c_4, d_4, C_3, D_3Polygon(A_2, B_2, 4) → poly1_5, a_5, b_5, c_5, d_5, C_2, D_2Polygon(A_1, B_1, 4) → poly1_6, a_6, b_6, c_6, d_6, C_1, D_1Textfield(a_1) → inputBox1_1LaTeX(f, true, true) → text12
AI Drawing Prompt Reference
Draw six consecutive quadrilaterals, each representing a step of polynomial long division, with the four vertices labeled by coefficients a, b, c, d and two opposite vertices marked as points; provide an editable text field for the first coefficient a and display the full polynomial f in LaTeX format on the canvas. Arrange the quadrilaterals side by side horizontally with uniform size to illustrate the division algorithm visually.
The prompt above was compiled from the original drawing commands and is for reference only.