
Linear Function Graphing by Godfrey Almeida
Loading the math board and drawing, please wait…
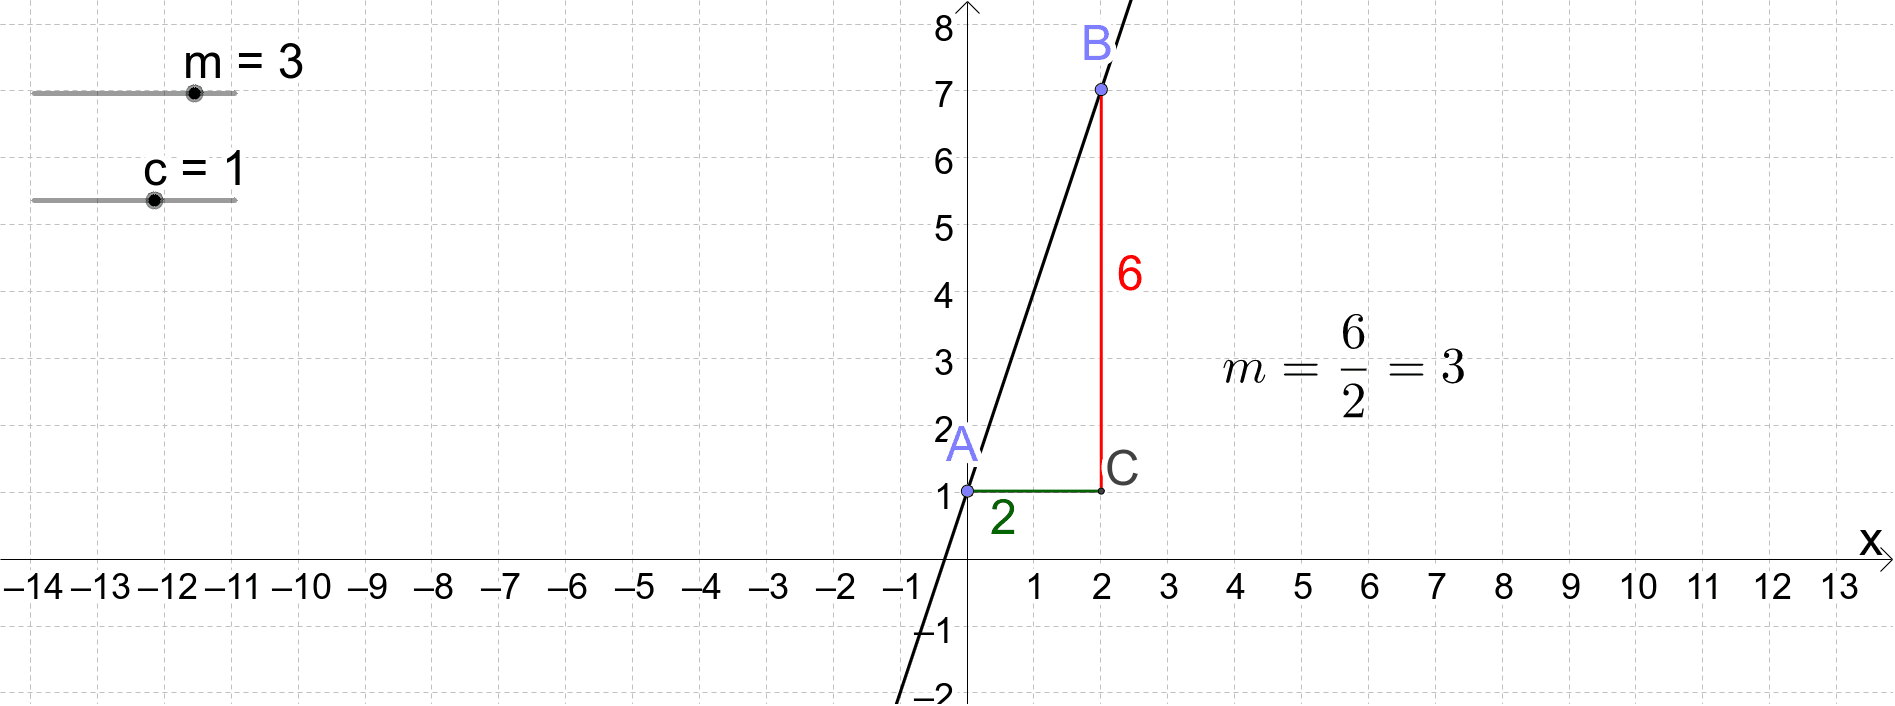
This example demonstrates how to graph the linear function y=mx+c using GeoGebra, showcasing the impact of slope m and y-intercept c on the line's position. Core mathematical concepts include linear functions, slope, y-intercept, and analytical geometry. Construction highlights involve commands like Point, OrthogonalLine, Intersect, Segment, along with objects such as sliders m and c, auxiliary points (a, A, B, b, d, C, e, f), and text label text1. Suitable for high school students learning about linear function transformations and classroom demonstrations.
GeoGebra Commands & Parameters
Point(a) → APoint(a) → BOrthogonalLine(A, yAxis) → bOrthogonalLine(B, b) → dIntersect(b, d) → CSegment(A, C) → eSegment(C, B) → f