
AFF Random Sampling Using a Spreadsheet
Loading the math board and drawing, please wait…
In collections
Math Year 4 Unit Probability & Statistics
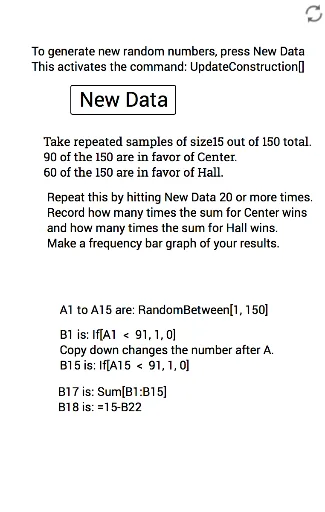
① This example demonstrates how to generate random samples satisfying specific conditions using GeoGebra's spreadsheet and random functions, and observe statistical properties of the samples. ② Core mathematical concepts include random sampling, probability, exponential functions, difference and slope, involving conditional logic and summation. ③ Construction highlights: uses Random command to generate random numbers, If command for conditional filtering, Sum command for aggregation; involves many spreadsheet cells (A2 to A15) and variables a to w, showing integration between spreadsheet and algebra view. ④ Suitable for high school or pre-university students learning probability and statistics, and for teachers demonstrating stochastic simulation processes.
GeoGebra Commands & Parameters
Random(1, 150) → A2Random(1, 150) → A3Random(1, 150) → A4Random(1, 150) → A5Random(1, 150) → A6Random(1, 150) → A7Random(1, 150) → A8Random(1, 150) → A9Random(1, 150) → A10Random(1, 150) → A11Random(1, 150) → A12Random(1, 150) → A13Random(1, 150) → A14Random(1, 150) → A15Random(1, 150) → aRandom(1, 150) → bRandom(1, 150) → cRandom(1, 150) → dRandom(1, 150) → eRandom(1, 150) → fRandom(1, 150) → gRandom(1, 150) → hRandom(1, 150) → iRandom(1, 150) → jRandom(1, 150) → kRandom(1, 150) → lRandom(1, 150) → mRandom(1, 150) → nRandom(1, 150) → oRandom(1, 150) → pRandom(1, 150) → qRandom(1, 150) → rRandom(1, 150) → sRandom(1, 150) → tRandom(1, 150) → uRandom(1, 150) → vRandom(1, 150) → wRandom(1, 150) → a_1Random(1, 150) → b_1Random(1, 150) → c_1Random(1, 150) → c_1Random(1, 150) → c_1Random(1, 150) → c_1Random(1, 150) → c_1Random(1, 150) → c_1Random(1, 150) → c_1Random(1, 150) → c_1Random(1, 150) → c_1Random(1, 150) → c_1Random(1, 150) → c_1Random(1, 150) → c_1Random(1, 150) → c_1Random(1, 150) → c_1Random(1, 150) → c_1Random(1, 150) → c_1Random(1, 150) → c_1Random(1, 150) → c_1Random(1, 150) → c_1Random(1, 150) → c_1Random(1, 150) → c_1Random(1, 150) → c_1Random(1, 150) → c_1Random(1, 150) → c_1Random(1, 150) → c_1Random(1, 150) → c_1Random(1, 150) → c_1Random(1, 150) → c_1Random(1, 150) → c_1Random(1, 150) → c_1Random(1, 150) → c_1Random(1, 150) → c_1Random(1, 150) → c_1Random(1, 150) → c_1Random(1, 150) → c_1Random(1, 150) → c_1Random(1, 150) → c_1Random(1, 150) → c_1Random(1, 150) → c_1Random(1, 150) → c_1Random(1, 150) → c_1Random(1, 150) → c_1Random(1, 150) → c_1Random(1, 150) → c_1Random(1, 150) → c_1Random(1, 150) → c_1Random(1, 150) → c_1Random(1, 150) → c_1Random(1, 150) → c_1Random(1, 150) → c_1Random(1, 150) → c_1Random(1, 150) → c_1Random(1, 150) → c_1Random(1, 150) → c_1Random(1, 150) → c_1Random(1, 150) → A1If(A1 < 91, 1, 0) → B1If(A2 < 91, 1, 0) → B2If(A3 < 91, 1, 0) → B3If(A4 < 91, 1, 0) → B4If(A5 < 91, 1, 0) → B5If(A6 < 91, 1, 0) → B6If(A7 < 91, 1, 0) → B7If(A8 < 91, 1, 0) → B8If(A9 < 91, 1, 0) → B9If(A10 < 91, 1, 0) → B10If(A11 < 91, 1, 0) → B11If(A12 < 91, 1, 0) → B12If(A13 < 91, 1, 0) → B13If(A14 < 91, 1, 0) → B14If(A15 < 91, 1, 0) → B15Random(1, 150) → RandomBetween[1, 150]Sum(B1:B15) → B17
AI Drawing Prompt Reference
Generate a sequence of 15 random numbers between 1 and 150, display them in a table, and create multiple variables a to w with the same range. Use these data for statistical analysis to visualize random sampling and probability distribution.
The prompt above was compiled from the original drawing commands and is for reference only.