
Adjustable Histogram
Loading the math board and drawing, please wait…
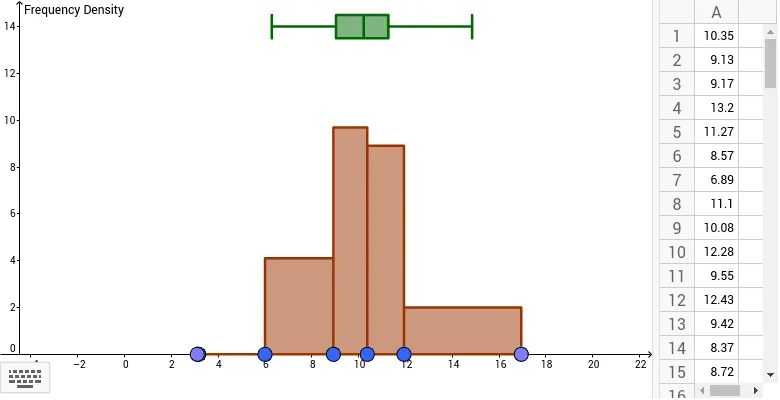
This example demonstrates the use of Geogebra's inbuilt Histogram tool to create an adjustable histogram from 50 data points sampled from a Normal distribution. It covers core concepts in Probability & Statistics, Normal distribution, and data analysis. Key GeoGebra commands and objects used include Point, RandomNormal, Ray, Sort, Histogram, and BoxPlot. Suitable for high school and above students learning data distribution and statistical visualization.
GeoGebra Commands & Parameters
Point(xAxis) → P_1Point(xAxis) → P_4Point(xAxis) → P_2Point(xAxis) → P_5Point(xAxis) → P_3RandomNormal(10, 2) → A1RandomNormal(10, 2) → A2RandomNormal(10, 2) → A3RandomNormal(10, 2) → A4RandomNormal(10, 2) → A5RandomNormal(10, 2) → A6RandomNormal(10, 2) → A7RandomNormal(10, 2) → A8RandomNormal(10, 2) → A9RandomNormal(10, 2) → A10RandomNormal(10, 2) → A11RandomNormal(10, 2) → A12RandomNormal(10, 2) → A13RandomNormal(10, 2) → A14RandomNormal(10, 2) → A15RandomNormal(10, 2) → A16RandomNormal(10, 2) → A17RandomNormal(10, 2) → A18RandomNormal(10, 2) → A19RandomNormal(10, 2) → A20RandomNormal(10, 2) → A21RandomNormal(10, 2) → A22RandomNormal(10, 2) → A23RandomNormal(10, 2) → A24RandomNormal(10, 2) → A25RandomNormal(10, 2) → A26RandomNormal(10, 2) → A27RandomNormal(10, 2) → A28RandomNormal(10, 2) → A29RandomNormal(10, 2) → A30RandomNormal(10, 2) → A31RandomNormal(10, 2) → A32RandomNormal(10, 2) → A33RandomNormal(10, 2) → A34RandomNormal(10, 2) → A35RandomNormal(10, 2) → A36RandomNormal(10, 2) → A37RandomNormal(10, 2) → A38RandomNormal(10, 2) → A39RandomNormal(10, 2) → A40RandomNormal(10, 2) → A41RandomNormal(10, 2) → A42RandomNormal(10, 2) → A43RandomNormal(10, 2) → A45RandomNormal(10, 2) → A46RandomNormal(10, 2) → A47RandomNormal(10, 2) → A48RandomNormal(10, 2) → A49RandomNormal(10, 2) → A50RandomNormal(10, 2) → A44Ray(Left, Left_1) → leftrayRay(Right, Right_1) → rightrayPoint(leftray) → P_0Point(rightray) → P_6Sort(Sequence[x(Element[Points, i + 1]), i, 0, 6]) → BoundariesHistogram(Boundaries, A1:A50) → histogramBoxPlot(14, 0.5, A1:A50) → boxplot
AI Drawing Prompt Reference
Create an adjustable histogram based on 50 data points randomly sampled from a normal distribution. First, create 5 points on the x-axis named P1 to P5. Then, generate 50 random numbers from a normal distribution named A1 to A50. Use these random numbers to create a histogram and ensure the histogram is adjustable.
The prompt above was compiled from the original drawing commands and is for reference only.