
Addition, Multiplication, Division, and Absolute Value Dynagraph
Loading the math board and drawing, please wait…
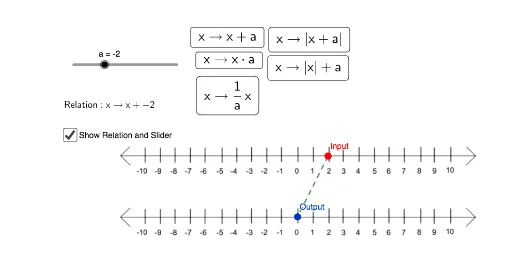
This example demonstrates the dynamic graphical representation of addition, multiplication, division, and absolute value operations, visually showcasing function transformations and operational relationships. It involves core mathematical concepts such as function transformations, absolute value properties, trigonometric functions, logarithmic functions, and optimization problems. The construction leverages GeoGebra commands like Line, Point, Segment, with objects including a, A, B, g, C, D, t, f, w, d, u, pic1, pic2, etc., and employs Slider Animation for dynamic visualization. Suitable for high school and above mathematics education, it aids in exploring function properties, visualizing operational patterns, and analyzing optimization problems.
GeoGebra Commands & Parameters
Line(A, B) → gPoint(g) → InputLine(C, D) → hSegment(Input, Output) → f