
Sketching and Interpreting Function Graphs: Extrema and Axial Symmetry
Loading the math board and drawing, please wait…
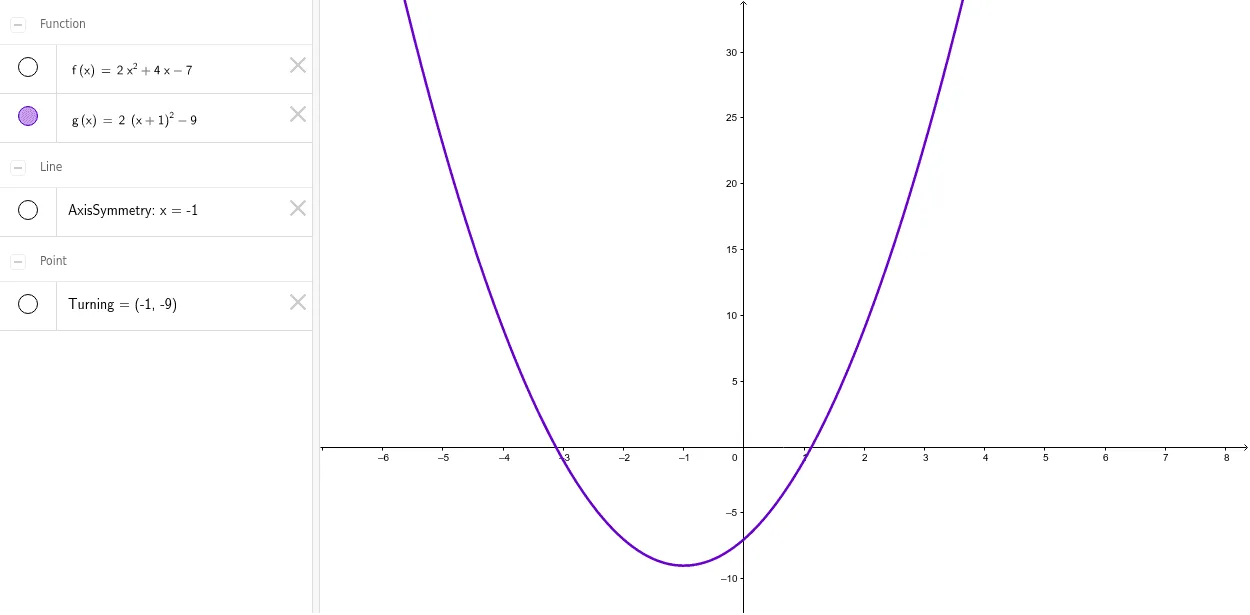
① This GeoGebra example demonstrates how to sketch and interpret function graphs, focusing on the extrema (turning points) of function f and its symmetry about an axis (AxisSymmetry), allowing learners to visually grasp key features of function graphs. ② Core mathematical concepts involved include function graphs, extrema (maxima and minima), axial symmetry, sine functions, sequences and series, and equilateral triangles, which are interrelated in the graphical representation to form a comprehensive mathematical exploration. ③ Construction highlights: Based on the construction summary, the Extremum command is used to mark the extrema of the function, with objects f, g, Turning, and AxisSymmetry defined to display the turning points and the axis of symmetry clearly. ④ This resource is suitable for high school mathematics courses on functions and graphing, as well as for pre-university review of function properties, or as an interactive tool for teacher demonstrations and student self-exploration to enhance understanding of function graph shapes and transformations.
GeoGebra Commands & Parameters
Extremum(f) → Turning
AI Drawing Prompt Reference
Draw a sine function graph and mark all its local extrema (turning points) with distinct dots. Add a vertical axis of symmetry that passes through the center of the graph, making the curve symmetric about this axis. The image should clearly show the curve, the marked extrema, and the symmetry axis, allowing easy observation of the function's increasing/decreasing behavior and its axial symmetry.
The prompt above was compiled from the original drawing commands and is for reference only.