
Transformation of Quadratic Functions: Shifts, Stretches, and Intersections
Loading the math board and drawing, please wait…
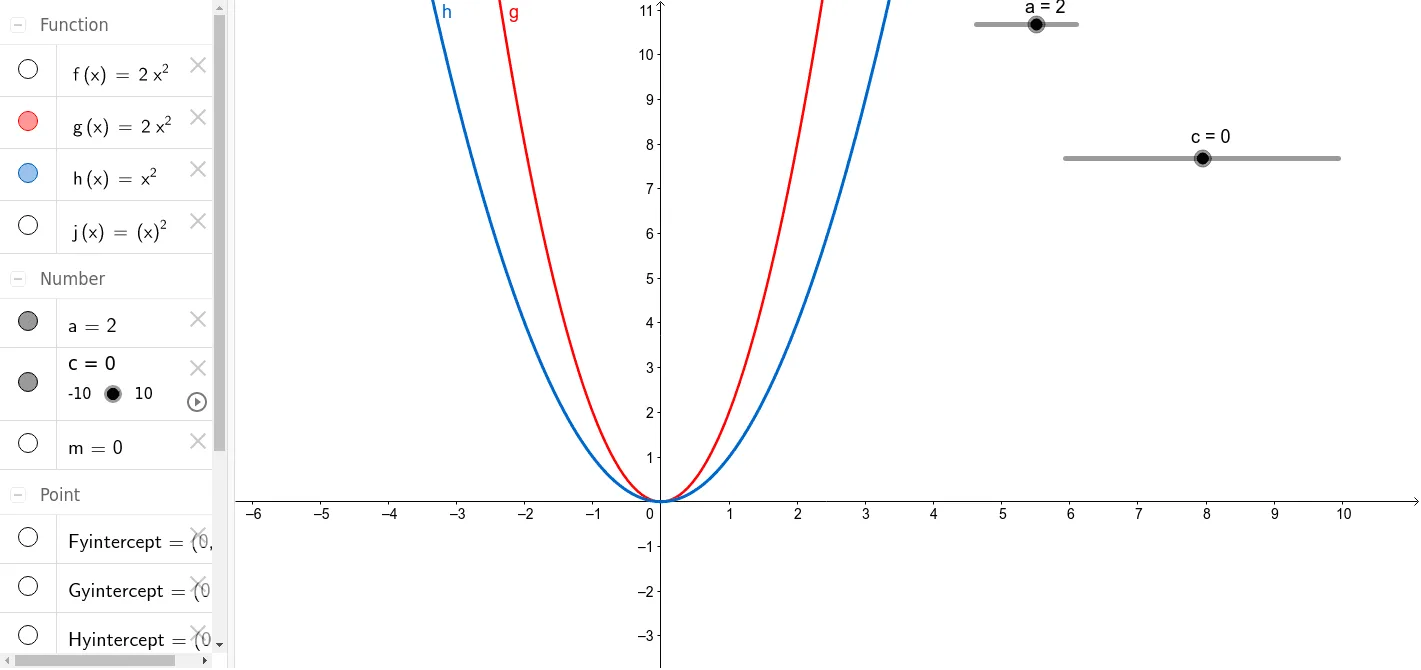
①This example dynamically demonstrates how quadratic functions change under translations and stretches, using intersection points and slopes to reveal relationships between coefficients and geometric features. ②Core math concepts include standard and vertex forms of quadratics, graph transformations (shifts and stretches), function intersections, slope, optimization, and curve sketching, with integer parameters for exploration. ③Construction highlights: GeoGebra commands Intersect and Slope are used to create intercepts (Gyintercept, Fyintercept, etc.) and compute slopes of relevant lines; objects c, a, g, f, h, j, m and text labels text2, text3 enable interactive parameter adjustments. ④Suitable for high school students learning function transformations, coordinate geometry, and introductory calculus, as well as for classroom demonstrations or self-guided exploration of quadratic properties.
GeoGebra Commands & Parameters
Intersect(g, yAxis) → GyinterceptIntersect(f, yAxis) → FyinterceptIntersect(h, yAxis) → HyinterceptIntersect(j, yAxis) → JyinterceptSlope(f) → m
AI Drawing Prompt Reference
Create a dynamic illustration showing how quadratic functions transform under translations and stretches, revealing relationships between coefficients and geometric features through intersection points and slopes. Include graphs of quadratic functions in standard and vertex forms, with their intersections along the coordinate axes. Use a slope tool to compute the slopes of relevant lines and display the intercepts with the y-axis. Provide interactive parameters and text labels to explain mathematical concepts, suitable for high school students learning function transformations, coordinate geometry, and introductory calculus.
The prompt above was compiled from the original drawing commands and is for reference only.