
Absolute Value Inequalities: Visualizing Solution Sets on the Number Line
Loading the math board and drawing, please wait…
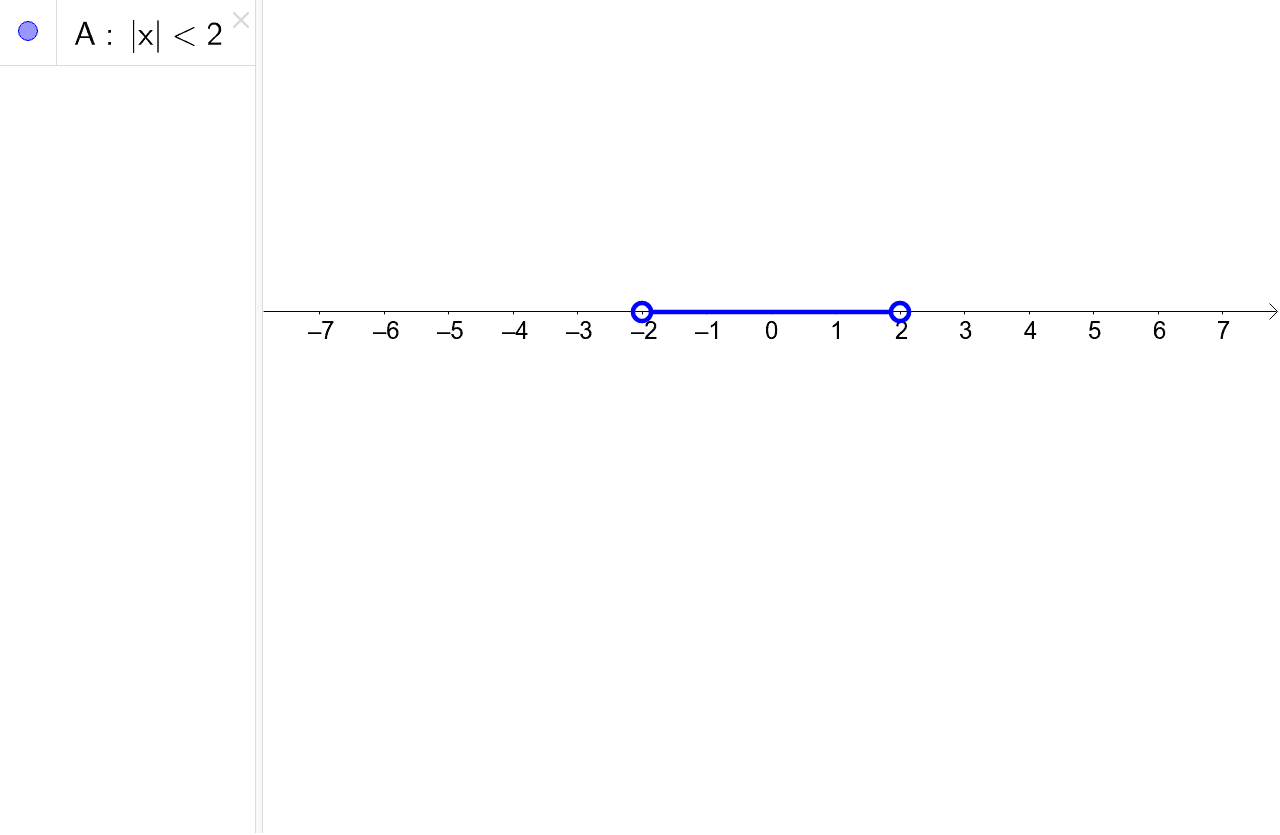
This GeoGebra example demonstrates how to visualize absolute value inequalities (e.g., |x-a|<b or |x-a|>b) on a number line, showing their solution sets as intervals or unions of intervals. The core mathematical concept is the geometric interpretation of absolute value as distance from a point, and how inequalities translate into regions on the number line. Construction highlights: a point A is placed on the number line as the center, with parameters adjustable via sliders or input fields; the inequality is graphed using GeoGebra's inequality or interval tools, highlighting the solution region. Suitable for middle-to-high school students learning algebra, this interactive tool bridges symbolic manipulation and geometric intuition, and can be used for classroom demonstrations or self-paced exploration.
GeoGebra Commands & Parameters
A(x) = abs(x) < 2