
Absolute Value Equations and Inequalities
Loading the math board and drawing, please wait…
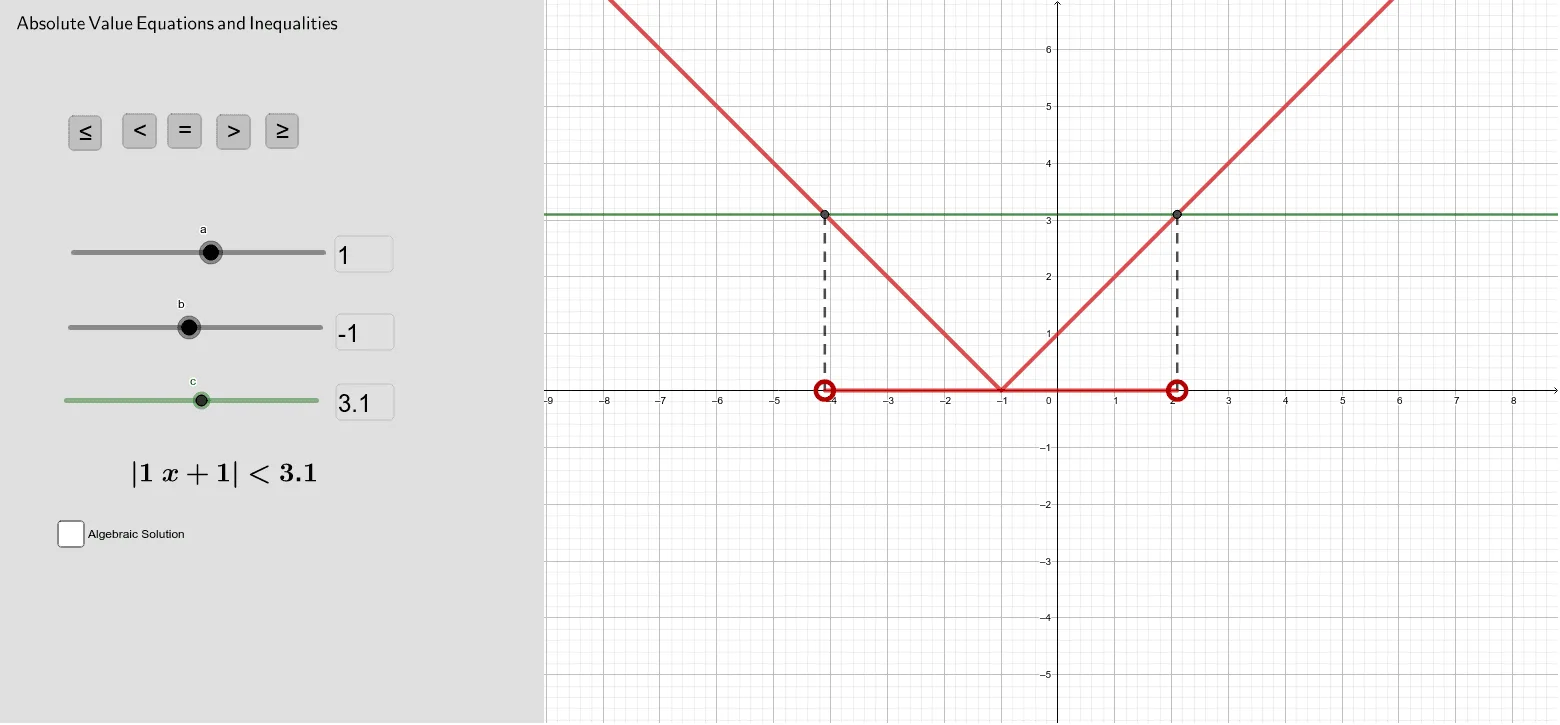
This example dynamically demonstrates the solutions of absolute value equations and inequalities, visually representing their geometric meanings. It involves core math concepts like absolute value, equation solutions, inequality regions, and number line representations. Constructed using commands such as Textfield, Intersect, Segment, and Vector, with interactive buttons and input boxes, it visualizes solution sets. Suitable for high school mathematics teaching to understand the properties and methods of absolute value functions, enhancing geometric intuition.
GeoGebra Commands & Parameters
Textfield(a) → InputBox1Intersect(f, g, -30, 30) → A, B, E,Segment(A, C) → iSegment(B, D) → lSegment(C, D) → mVector(C, C') → uVector(D, D') → vTextfield(b) → InputBox2Textfield(c) → InputBox3
AI Drawing Prompt Reference
Create a dynamic visualization showing solutions to absolute value equations and inequalities. Include an input for parameter a, determine key points by intersecting function graphs with the x-axis, and connect these points with line segments to display solution sets. Add inputs for parameters b and c, and use vectors to indicate directions, constructing the overall shape to illustrate the geometric meaning of absolute value functions and regions of inequality solutions.
The prompt above was compiled from the original drawing commands and is for reference only.