
3D Implicit Surface Grapher: Atomic Orbitals
Loading the math board and drawing, please wait…
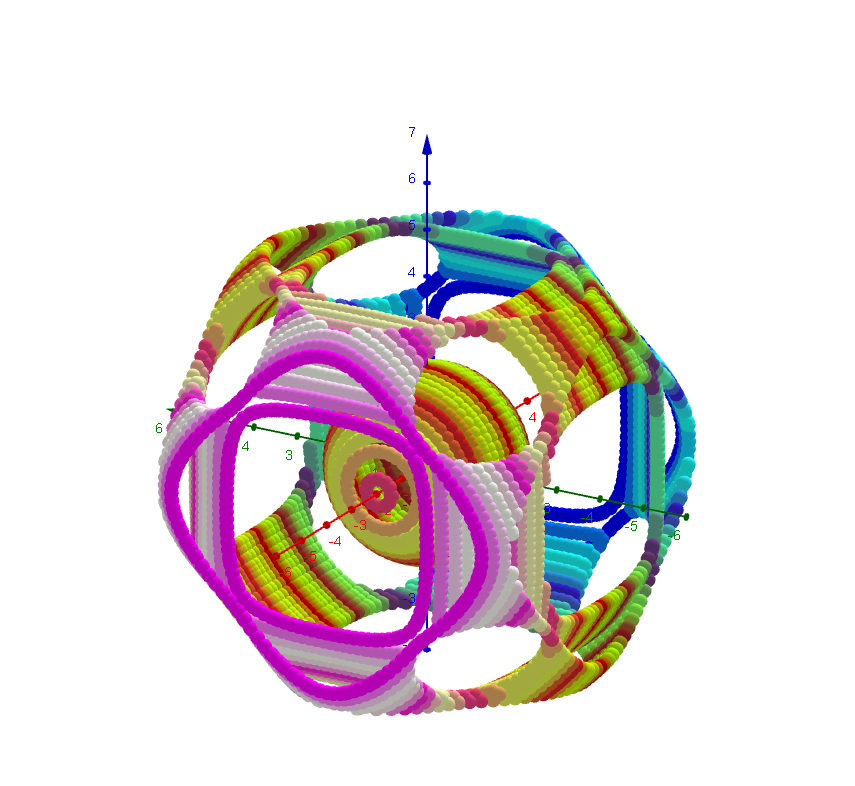
This example demonstrates how to graph 3D atomic orbitals using predefined implicit functions. Key math concepts include implicit functions, 3D analytical geometry, trigonometric functions, and hypergeometric distribution. GeoGebra commands and objects used in the construction summary are Textfield, objects (g, Nn, etc.), buttons, and text boxes for inputting formulas, setting parameter ranges, and generating graphs. Suitable for high school students and above or math enthusiasts studying 3D graphing and atomic physics.
GeoGebra Commands & Parameters
Textfield(x_{min}) → Textfeld1Textfield(y_{min}) → Textfeld2Textfield(z_{min}) → Textfeld3Textfield(x_{max}) → Textfeld4Textfield(y_{max}) → Textfeld5Textfield(z_{max}) → Textfeld6Textfield(Nn) → Textfeld10Textfield(g) → Textfeld13Textfield(b) → inputBox1
AI Drawing Prompt Reference
Create a 3D implicit surface graph to visualize atomic orbitals, inputting the minimum and maximum values for x, y, and z to set the display range, and parameters Nn, g, and b to define the orbital equations, generating a 3D graph suitable for those studying 3D analytical geometry and trigonometric functions.
The prompt above was compiled from the original drawing commands and is for reference only.