
3D Implicit Function Plotter: cos40
Loading the math board and drawing, please wait…
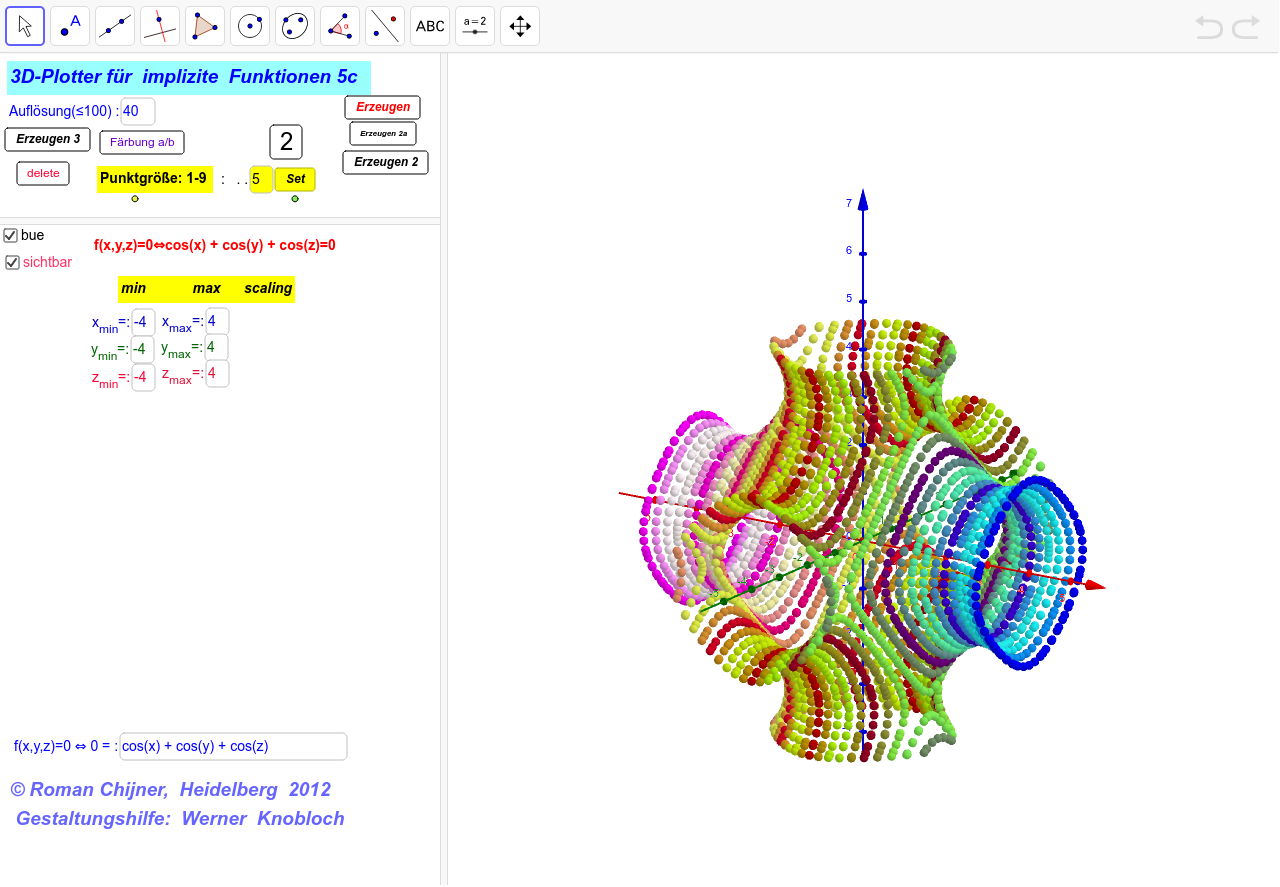
This example demonstrates the 3D graph of the implicit function cos40. Key mathematical concepts include trigonometry and coordinate geometry. Using GeoGebra commands such as If, Textfield, button, etc., complex 3D graphs can be constructed. Suitable for high school and above students or teachers.
GeoGebra Commands & Parameters
If(bue, cos(x) + cos(y) + cos(z), x^(2) + y^(2) / 4 - z^(2) / 9 - 1) → gTextfield(x_{min}) → Textfeld1Textfield(y_{min}) → Textfeld2Textfield(z_{min}) → Textfeld3Textfield(x_{max}) → Textfeld4Textfield(y_{max}) → Textfeld5Textfield(z_{max}) → Textfeld6Textfield(Nn) → Textfeld10Textfield(g) → Textfeld13Textfield(b) → inputBox1
AI Drawing Prompt Reference
Plot a 3D implicit function graph where the function is cos(x) + cos(y) + cos(z), showing this function when bue is true, otherwise showing x^2 + y^2/4 - z^2/9 - 1 = 0. Set the minimum and maximum values for x, y, and z as Textfeld1, Textfeld2, Textfeld3, Textfeld4, Textfeld5, and Textfeld6 respectively, with Nn as the number of grid lines, g as the function name, and b as a boolean value.
The prompt above was compiled from the original drawing commands and is for reference only.