
3D i Distribution Visualization
Loading the math board and drawing, please wait…
In collections
Complex Math
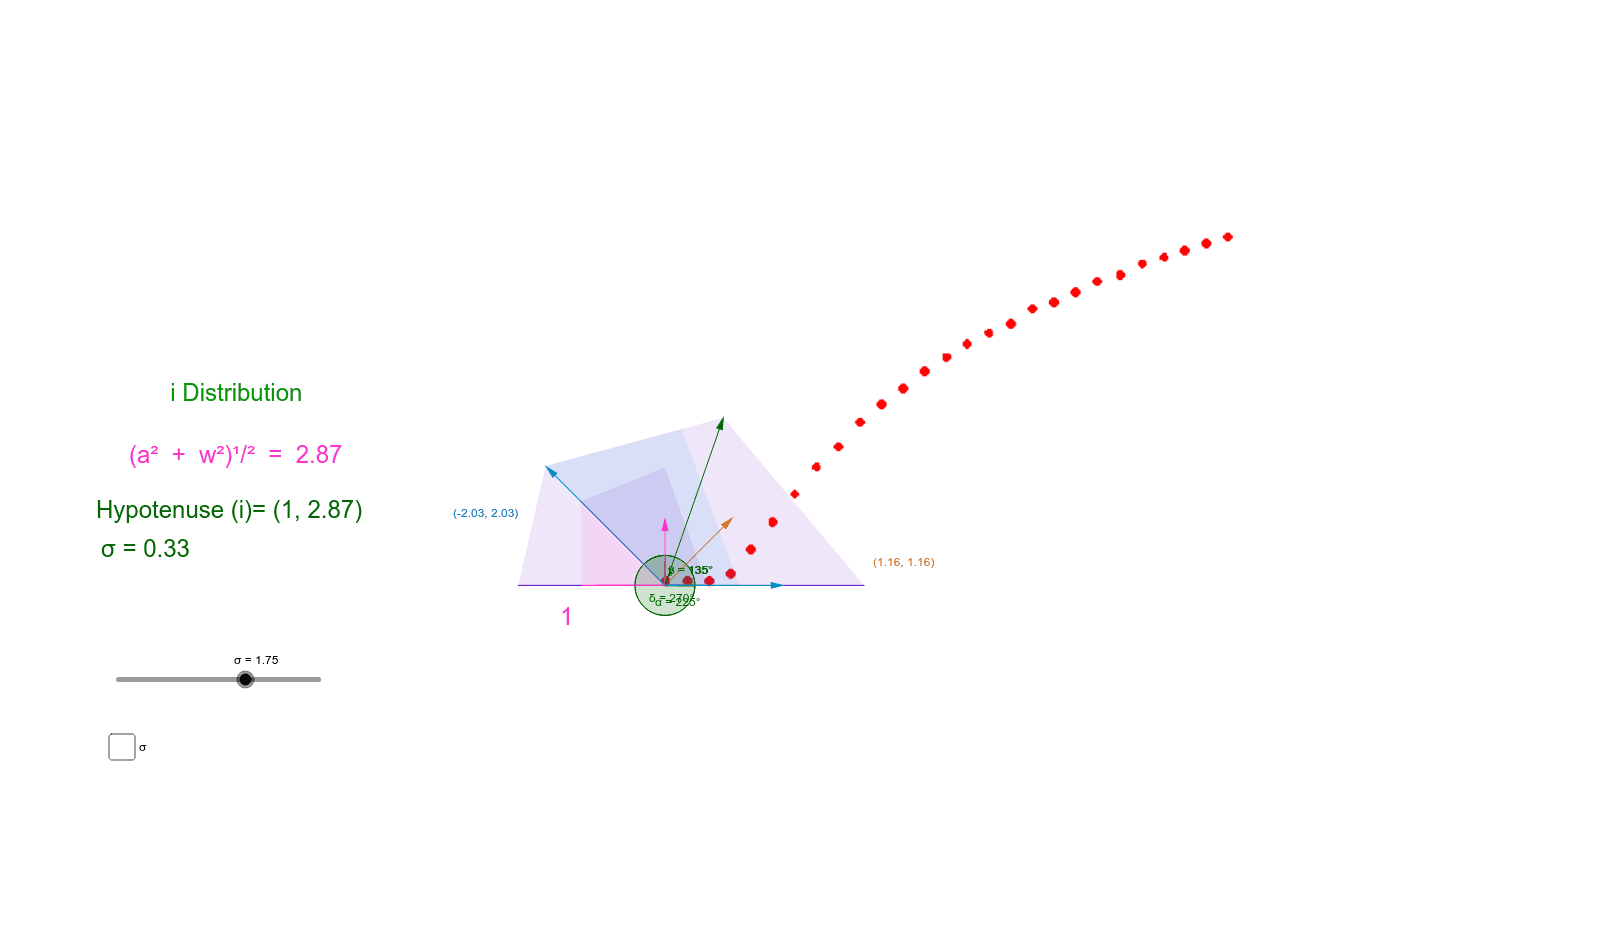
This example demonstrates how to construct a three-dimensional distribution for the variable i. Key math concepts include 3D space, distribution functions, vectors, and coordinate geometry. Construction highlights involve using GeoGebra commands like Vector, Angle, Point, Segment, Polygon, Intersect, and Integral, as outlined in the summary. Suitable for high school and above, focusing on 3D visualization and integral applications in complex functions.
GeoGebra Commands & Parameters
Vector((0, 1.16)) → uVector((1.16, 0)) → v_1Angle(b, a) → αAngle(a, b) → βAngle(a, b) → γAngle(w, a) → δPoint(w) → APoint(b) → BSegment(A, B) → dPoint(a) → CSegment(A, C) → pPoint(w) → DSegment(A, D) → fAngle(C, A, B) → εAngle(C, A, D) → ζPolygon(A, C, D, B) → poly1, a_1, c_1, d_1, b_1Point(w) → EPoint(a) → FSegment(F, E) → gPoint(b) → GSegment(G, E) → hIntersect(d_1, b_1) → HIntersect(c_1, d_1) → IIntersect(a_1, c_1) → JPolygon(H, I, J, F, E, G) → poly2, h_1, i, j, f_1, e_1, g_1Point(p_1) → KVector(A, K) → kSegment(A, F) → l_2Segment(A, K) → mAngle(C, A, K) → ηSegment(A, E) → nAngle(K, A, E) → θPoint(s) → LPolygon(A, L, G) → poly3, g_2, a_2, l_1Vector((0, 0), (1.16, 1.16)) → qPoint(b_1) → MSegment(A, M) → lPoint(q) → NSegment(A, N) → i_1Angle(c_1, b_1) → ιAngle(N, A, B) → κIntegral(r_1, -10, 10) → vPoint(b) → QPoint(w) → SPoint(r_1) → WPolygon(Q, S, W, A) → poly4, q_2, s_1, w_1, a_3Polygon(A, Z, T) → poly6, t_2, a_5, z_1Point(b) → A_1Point(k) → B_1Point(r_1) → C_1Point(r_1) → D_1Polygon(C_1, B_1, A_1, D_1) → poly5, c_2, b_2, a_4, d_2Segment(W, B_1) → oPoint(d_2) → E_1Point(b_2) → F_1Intersect(b_2, a_4) → G_1Polygon(E_1, F_1, G_1, A) → poly7, e_2, f_2, g_3, a_6Point(q_2) → I_1Point(d_2) → H_1Polygon(H_1, A, I_1) → poly8, i_2, h_2, a_7
AI Drawing Prompt Reference
Visualize a 3D distribution for the variable i, highlighting key mathematical concepts like distribution functions, vectors, and coordinate geometry. Start by constructing two vectors u and v_1, then use angles α, β, γ, δ, and points A, B, C, D, E, F, G, H, I, J, K, L, M, N, Q, S, W, Z, T to create complex geometric structures through line segments, polygons, and integrals, showcasing the shape of the distribution function and integral applications.
The prompt above was compiled from the original drawing commands and is for reference only.