
3D Graphing and Transformations
Loading the math board and drawing, please wait…
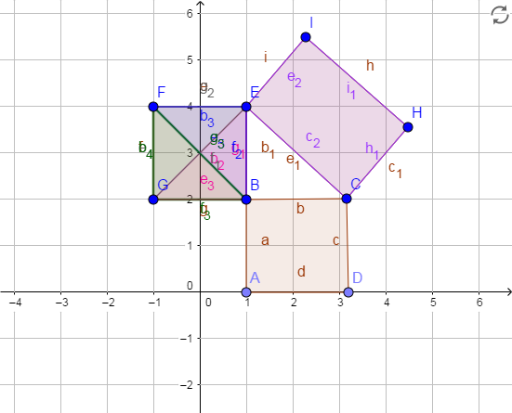
This example demonstrates the plotting and transformation of graphs in 3D space, focusing on polygons and function graphs. Key math concepts include function graphs, similarity transformations, coordinate geometry, and solid geometry. Construction highlights involve commands like Point, Polygon, and Sliders. Suitable for high school and above students to explore properties and transformations of 3D graphs.
GeoGebra Commands & Parameters
Point(xAxis) → APoint(xAxis) → DPolygon(A, B, C, D) → poly1, a, b, c, dPolygon(B, E, F, G) → poly2, b_1, e, f, gPolygon(E, C, H, I) → poly3, e_1, c_1, h, iPolygon(I, H, C, E) → poly4, i_1, h_1, c_2, e_2Polygon(E, B, G) → poly5, g_1, e_3, b_2Polygon(E, F, G) → poly6, g_2, e_4, f_1Polygon(B, F, E) → poly7, e_5, b_3, f_2Polygon(F, G, B) → poly8, b_4, f_3, g_3
AI Drawing Prompt Reference
Create a 3D shape consisting of eight triangles and parallelograms using points A, D, E, and B. Start by placing points A and D on the x-axis, then connect these points to form four parallelograms and four triangles, ensuring all shapes are correctly positioned in 3D space.
The prompt above was compiled from the original drawing commands and is for reference only.