
200 Meter Running Speed Calculator
Loading the math board and drawing, please wait…
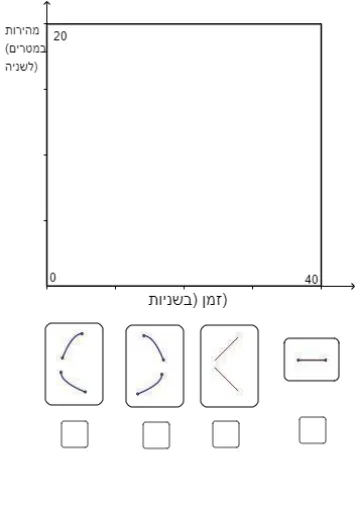
This example demonstrates how to use GeoGebra to create a 200-meter running speed calculator, involving core mathematical concepts such as function graphs and linear programming or linear optimization. Key construction points include using commands like Line (straight line), Point (point), OrthogonalLine (perpendicular line), Intersect (intersection), Textfield (text field), Polygon (polygon), RotateText (rotated text), Segment (segment), TableText (table text), and Mirror (mirror), along with objects like f, h, g, p, a, A, B, etc. Suitable for high school and above students learning function graph plotting and optimization problems.
GeoGebra Commands & Parameters
Line(C, xAxis) → l_9Line(D, l_9) → jPoint(l_9) → EOrthogonalLine(E, l_9) → kIntersect(j, k) → FPoint(l_9) → HOrthogonalLine(H, l_9) → lPoint(l) → IOrthogonalLine(I, l) → l_6Point(l) → JOrthogonalLine(J, l) → l_3Point(l_6) → LOrthogonalLine(L, l_6) → l_7Intersect(l_7, l_3) → MTextfield(t) → InputBox4Polygon({(0, 0), (40, 0), (40, 20), (0, 20)}) → poly2Textfield(n_1) → InputBox7RotateText(" distance along track (meters)", 90°) → text8Point(yAxis) → SSegment(S, T) → mascIntersect(f_1, masc) → UIntersect(p_1, masc) → WPolygon((0, 3), (200, 3), (200, -5), (0, -5)) → poly1, maslul, masl, masb, maseSegment((0, 1.4), (200, 1.4)) → masmSegment((0, -0.2), (200, -0.2)) → masnSegment((0, -1.8), (200, -1.8)) → masdSegment((0, -3.4), (200, -3.4)) → masfTableText({{tab_5, tab_1, tab_2, tab_3, tab_4}, {A2, B2, C2, D2, E2}, {A3, B3, C3, D3, E3}, {A4, B4, C4, D4, E4}, {A5, B5, C5, D5, E5}, {A6, B6, C6, D6, E6}, {A12, B12, C12, D12, E12}}, "|_") → text7OrthogonalLine(Q, xAxis) → l_2Mirror(P, l_2) → P'OrthogonalLine(R, xAxis) → l_8Mirror(A_1, l_8) → B_1Segment(C_1, D_1) → masLine(E_1, xAxis) → l_4Point(l_4) → F_1Segment(E_1, F_1) → masa