
200-meter Dash Task
Loading the math board and drawing, please wait…
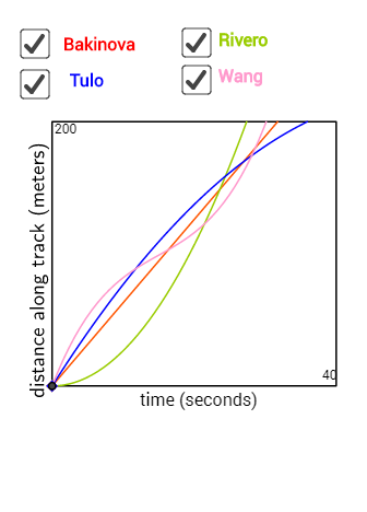
This example demonstrates the geometric relationship between parabolas and hyperbolas in a 200-meter dash track, along with derivative applications. Core math concepts include parabolas, hyperbolas, orthocenter, derivatives, curve sketching. Construction highlights from the summary involve commands like Line, Point, OrthogonalLine, Intersect, Textfield, Polygon, RotateText, Segment, TableText, and objects such as buttons and input boxes. Suitable for high school and above, focusing on the application of analytical geometry and calculus in real-world problems.
GeoGebra Commands & Parameters
Line(C, xAxis) → iLine(D, i) → jPoint(i) → EOrthogonalLine(E, i) → kIntersect(j, k) → FPoint(i) → HOrthogonalLine(H, i) → lPoint(l) → IOrthogonalLine(I, l) → qPoint(l) → JOrthogonalLine(J, l) → rPoint(q) → LOrthogonalLine(L, q) → sIntersect(s, r) → MTextfield(t) → InputBox4Polygon({(0, 0), (40, 0), (40, 200), (0, 200)}) → poly2Textfield(n_1) → InputBox7RotateText(" distance along track (meters)", 90°) → text8Point(yAxis) → SSegment(S, T) → g_1Intersect(f_1, g_1) → UIntersect(p_1, g_1) → WPolygon((0, 3), (200, 3), (200, -5), (0, -5)) → poly1, b, c, e, i_1Segment((0, 1.4), (200, 1.4)) → j_1Segment((0, -0.2), (200, -0.2)) → k_1Segment((0, -1.8), (200, -1.8)) → l_1Segment((0, -3.4), (200, -3.4)) → m_1TableText({{tab_5, tab_1, tab_2, tab_3, tab_4}, {A2, B2, C2, D2, E2}, {A3, B3, C3, D3, E3}, {A4, B4, C4, D4, E4}, {A5, B5, C5, D5, E5}, {A6, B6, C6, D6, E6}, {A7, B7, C7, D7, E7}, {A8, B8, C8, D8, E8}, {A9, B9, C9, D9, E9}, {A10, B10, C10, D10, E10}, {A11, B11, C11, D11, E11}, {n_1, g(n_1), p(n_1), h_1(n_1), q_1(n_1)}}, "|_r") → text7
AI Drawing Prompt Reference
Draw a 200-meter dash track with the geometric relationships of parabolas and hyperbolas. Start by drawing the x-axis and y-axis, then draw two lines through points C and D, find their perpendicular lines to get points E and F, next draw two lines through points H and I, find their perpendicular lines to get points J and L, and then find point M. Draw a line segment g1 through point S on the y-axis, find its intersections with the parabola f1 and the hyperbola p1 to get points U and W. Finally, draw the boundary polygon of the track and the distance marking line segments.
The prompt above was compiled from the original drawing commands and is for reference only.