
波动方程演示
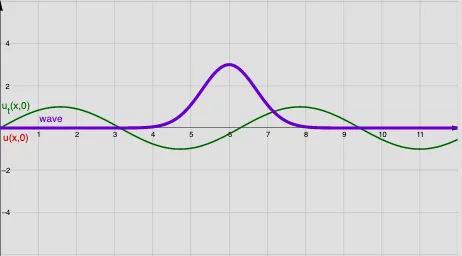
几何画板及绘图内容加载中,请稍等……
①本范例演示了波动方程在给定边界条件下的解的图形表示;②涉及的核心数学概念包括傅里叶级数、三角函数、序列求和、多边形构造等;③作图要点——从下方『构造摘要』提炼用到了 Sequence, Sum, Polygon, Textfield 等GeoGebra命令/对象;④适合高中及以上学生学习和理解波动现象的数学建模。
GeoGebra 命令及参数
Sequence((2 / L * Integral[(f(x) * sin((((π * x) * i)) / L)), 0, L]), i, 1, n) → AnSequence((2 / (((i * π) * a)) * Integral[(g(x) * sin((((π * x) * i)) / L)), 0, L]), i, 1, n) → BnSequence(((Element[An, i] * cos((((i * π) * a) * y / L))) * sin(((i * π) * x / L))), i, 1, n) → AnCSSequence(((Element[Bn, i] * sin((((i * π) * a) * y / L))) * sin(((i * π) * x / L))), i, 1, n) → BnSSSequence(Element[AnCS, i] + Element[BnSS, i], i, 1, n) → AnBnSum(AnBn, n) → uPolygon((xmin1, -0.5), (-0.05, -0.5), (-0.05, 0.5), (xmin1, 0.5)) → Range1, h, i, j, kPolygon((xmin2, ymin2), (L, ymin2), (L, ymax2), (xmax2, ymax2)) → Range2, l, m, p, qTextfield(f0) → InputBox1Textfield(g0) → InputBox2Textfield(L) → InputBox3Textfield(a) → InputBox4Textfield(n) → InputBox5