
两个分布的方差比较可视化
几何画板及绘图内容加载中,请稍等……
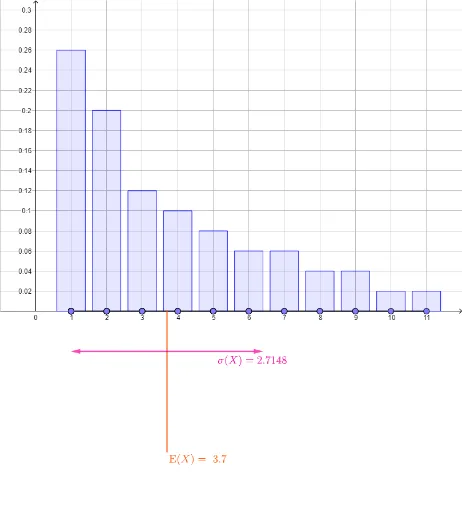
该范例通过GeoGebra动态展示两个不同分布的方差对比,直观呈现数据离散程度的差异。核心数学概念包括统计中的均值、方差、标准差以及分布形状。作图要点:使用Segment和Point构造数据点,mean计算均值,stdevp计算总体标准差,BarChart绘制柱状图,Vector表示偏差向量,并利用多个文本对象(text1至text7)标注关键数值。适合高中及大学统计学入门教学,帮助学生理解方差作为离散程度度量的意义,以及不同分布形态对方差的影响。
GeoGebra 命令及参数
Segment((1, 0), (11, 0)) → thexaxisPoint(thexaxis) → A12Point(thexaxis) → A13Point(thexaxis) → A14Point(thexaxis) → A15Point(thexaxis) → A16Point(thexaxis) → A17Point(thexaxis) → A18Point(thexaxis) → A19Point(thexaxis) → A20Point(thexaxis) → A21Point(thexaxis) → A22Point(thexaxis) → A23Point(thexaxis) → A24Point(thexaxis) → A25Point(thexaxis) → A26Point(thexaxis) → A27Point(thexaxis) → A28Point(thexaxis) → A29Point(thexaxis) → A30Point(thexaxis) → A31Point(thexaxis) → A32Point(thexaxis) → A33Point(thexaxis) → A34Point(thexaxis) → A35Point(thexaxis) → A36Point(thexaxis) → A37Point(thexaxis) → A38Point(thexaxis) → A39Point(thexaxis) → A40Point(thexaxis) → A41Point(thexaxis) → A42Point(thexaxis) → A43Point(thexaxis) → A44Point(thexaxis) → A45Point(thexaxis) → A46Point(thexaxis) → A47Point(thexaxis) → A48Point(thexaxis) → A49Point(thexaxis) → A50Point(thexaxis) → B13Point(thexaxis) → B14Point(thexaxis) → B15Point(thexaxis) → B16Point(thexaxis) → B17Point(thexaxis) → B18Point(thexaxis) → B19Point(thexaxis) → B20Point(thexaxis) → B21Point(thexaxis) → B22Point(thexaxis) → B23Point(thexaxis) → B24Point(thexaxis) → B25Point(thexaxis) → B26Point(thexaxis) → B27Point(thexaxis) → B28Point(thexaxis) → B29Point(thexaxis) → B30Point(thexaxis) → B31Point(thexaxis) → B32Point(thexaxis) → B33Point(thexaxis) → B34Point(thexaxis) → B35Point(thexaxis) → B36Point(thexaxis) → B37Point(thexaxis) → B38Point(thexaxis) → B39Point(thexaxis) → B40Point(thexaxis) → B41Point(thexaxis) → B42Point(thexaxis) → B43Point(thexaxis) → B44Point(thexaxis) → B45Point(thexaxis) → B46Point(thexaxis) → B47Point(thexaxis) → B48Point(thexaxis) → B49Point(thexaxis) → B50mean(thexs1) → mean1mean(thexs2) → mean2Segment((mean1, (meandepth * ymin)), (mean1, 0)) → meanpos1Segment((mean2, (meandepth * ymin)), (mean2, 0)) → meanpos2Point(thexaxis) → B12BarChart(Sequence[11], freq1, 0.8) → dist1BarChart(Sequence[11], freq2, 0.8) → dist2Point(thexaxis) → A11Point(thexaxis) → B11Point(thexaxis) → A1Point(thexaxis) → A2Point(thexaxis) → A3Point(thexaxis) → A4Point(thexaxis) → A5Point(thexaxis) → A6Point(thexaxis) → A7Point(thexaxis) → A8Point(thexaxis) → A9Point(thexaxis) → A10Point(thexaxis) → B1Point(thexaxis) → B2Point(thexaxis) → B3Point(thexaxis) → B4Point(thexaxis) → B5Point(thexaxis) → B6Point(thexaxis) → B7Point(thexaxis) → B8Point(thexaxis) → B9Point(thexaxis) → B10stdevp(thexs1) → sd1stdevp(thexs2) → sd2Vector((mean1, (sddepth * ymin)), (mean1 - sd1, (sddepth * ymin))) → sdleft1Vector((mean1, (sddepth * ymin)), (mean1 + sd1, (sddepth * ymin))) → sdright1Vector((mean2, (sddepth * ymin)), (mean2 - sd2, (sddepth * ymin))) → sdleft2Vector((mean2, (sddepth * ymin)), (mean2 + sd2, (sddepth * ymin))) → sdright2
AI 绘图提示语参考
在横轴上绘制50个点,然后在这50个点的基础上分别生成两组数据点,每组25个点,用条形图表示这两组数据的分布情况,并计算每组数据的平均值、标准差和方差,用箭头表示每个数据点到平均值的偏差,最后用文本标注出每组数据的平均值、标准差和方差。
以上提示语为根据原始绘图命令整理而来,仅供参考。