
统计信息可视化
几何画板及绘图内容加载中,请稍等……
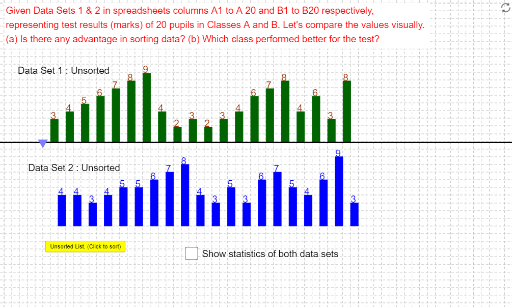
该范例展示了两个班级A和B的20名学生的考试分数分布情况,通过统计学特征如均值、中位数、众数和标准差来分析数据。使用了Sort、Intersect、Point、Sequence等GeoGebra命令进行数据排序和处理。适合中学阶段统计学教学。
GeoGebra 命令及参数
Sort(list1) → list1sortedIntersect(xAxis, yAxis) → APoint(xAxis) → BPoint(yAxis) → DSort(list2) → list2sortedSequence(Polygon[(n - 1, 0), (n, 0), (n, Element[list2, n / 2]), (n - 1, Element[list2, n / 2])], n, 2, 42, 2) → list2barsSequence(Polygon[(n - 2, 0), (n - 1, 0), (n - 1, Element[list2sorted, n / 2]), (n - 2, Element[list2sorted, n / 2])], n, 2, 42, 2) → list2sortedbarsPoint(l1) → O_1Sequence(Polygon[(n - 2, l1(0)), (n - 1, l1(0)), (n - 1, Element[list1sorted, n / 2] + l1(0)), (n - 2, Element[list1sorted, n / 2] + l1(0))], n, 2 + x(O_1), 41, 2) → list1sortedbarsSequence(Polygon[(n - 1, l1(n - 1)), (n, l1(n)), (n, Element[list1, n / 2] + l1(n)), (n - 1, Element[list1, n / 2] + l1(n - 1))], n, 2 + x(O_1), 42 + x(O_1), 2) → list1barsSequence(Text[Element[list1, n / 2], (n - 1, Element[list1, n / 2] + l1(0))], n, 2 + x(O_1), 42 + x(O_1), 2) → list1barstextSequence(Text[Element[list1sorted, n / 2], (n - 2, Element[list1sorted, n / 2] + l1(0))], n, 2 + x(O_1), 42 + x(O_1), 2) → list1sortedbarstextSequence(Text[Element[list2, n / 2], (n - 1, Element[list2, n / 2])], n, 2, 42, 2) → list2barstextSequence(Text[Element[list2sorted, n / 2], (n - 2, Element[list2sorted, n / 2])], n, 2, 42, 2) → list2sortedbarstext
AI 绘图提示语参考
绘制两个班级A和B的20名学生测试分数的直方图,包括两个横轴和纵轴,横轴分别表示两个班级的分数段,纵轴表示每个分数段的学生人数。使用直方图展示每个班级的分数分布,并标注每个分数段的中位数。
以上提示语为根据原始绘图命令整理而来,仅供参考。