
两个分布的众数、中位数与期望值
几何画板及绘图内容加载中,请稍等……
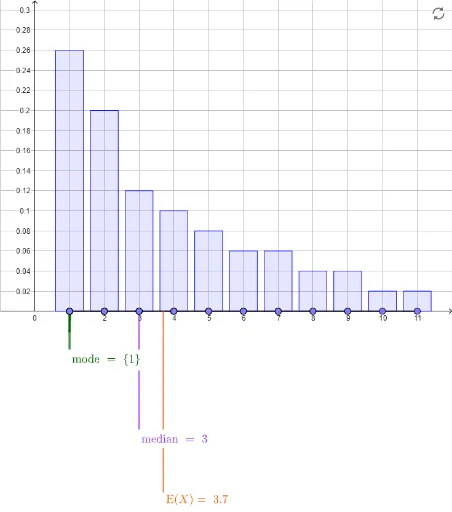
①本范例演示了两个不同分布的众数、中位数和期望值的计算与可视化;②涉及的核心数学概念包括概率统计中的分布、众数、中位数、期望值,以及解析几何中的数据表示;③作图要点提炼自GeoGebra命令:Segment(线段)、Point(点)、mean(均值)、Median(中位数)、If(条件判断)、Length(长度)、Sequence(数列)、BarChart(条形图);④适合高中及以上学生学习和理解概率统计与数据分析。
GeoGebra 命令及参数
Segment((1, 0), (11, 0)) → thexaxisPoint(thexaxis) → A12Point(thexaxis) → A13Point(thexaxis) → A14Point(thexaxis) → A15Point(thexaxis) → A16Point(thexaxis) → A17Point(thexaxis) → A18Point(thexaxis) → A19Point(thexaxis) → A20Point(thexaxis) → A21Point(thexaxis) → A22Point(thexaxis) → A23Point(thexaxis) → A24Point(thexaxis) → A25Point(thexaxis) → A26Point(thexaxis) → A27Point(thexaxis) → A28Point(thexaxis) → A29Point(thexaxis) → A30Point(thexaxis) → A31Point(thexaxis) → A32Point(thexaxis) → A33Point(thexaxis) → A34Point(thexaxis) → A35Point(thexaxis) → A36Point(thexaxis) → A37Point(thexaxis) → A38Point(thexaxis) → A39Point(thexaxis) → A40Point(thexaxis) → A41Point(thexaxis) → A42Point(thexaxis) → A43Point(thexaxis) → A44Point(thexaxis) → A45Point(thexaxis) → A46Point(thexaxis) → A47Point(thexaxis) → A48Point(thexaxis) → A49Point(thexaxis) → A50Point(thexaxis) → B13Point(thexaxis) → B14Point(thexaxis) → B15Point(thexaxis) → B16Point(thexaxis) → B17Point(thexaxis) → B18Point(thexaxis) → B19Point(thexaxis) → B20Point(thexaxis) → B21Point(thexaxis) → B22Point(thexaxis) → B23Point(thexaxis) → B24Point(thexaxis) → B25Point(thexaxis) → B26Point(thexaxis) → B27Point(thexaxis) → B28Point(thexaxis) → B29Point(thexaxis) → B30Point(thexaxis) → B31Point(thexaxis) → B32Point(thexaxis) → B33Point(thexaxis) → B34Point(thexaxis) → B35Point(thexaxis) → B36Point(thexaxis) → B37Point(thexaxis) → B38Point(thexaxis) → B39Point(thexaxis) → B40Point(thexaxis) → B41Point(thexaxis) → B42Point(thexaxis) → B43Point(thexaxis) → B44Point(thexaxis) → B45Point(thexaxis) → B46Point(thexaxis) → B47Point(thexaxis) → B48Point(thexaxis) → B49Point(thexaxis) → B50mean(thexs1) → mean1mean(thexs2) → mean2Median(thexs1) → median1Median(thexs2) → median2If(Length[Mode[thexs1]] ≟ 0, Sequence[10], Mode[thexs1]) → mode1If(Length[Mode[thexs2]] ≟ 0, Sequence[10], Mode[thexs2]) → mode2Length(mode1) → nummode1Length(mode2) → nummode2Segment((median1, (mediandepth * ymin)), (median1, 0)) → meadianpos1Segment((mean1, (meandepth * ymin)), (mean1, 0)) → meanpos1Segment((median2, (mediandepth * ymin)), (median2, 0)) → medianpos2Segment((mean2, (meandepth * ymin)), (mean2, 0)) → meanpos2Sequence(Segment[(mode1(i), ((1 / 2 * modedepth) * ymin)), (mode1(i), 0)], i, 1, nummode1) → modepos1Sequence(Segment[(mode2(i), ((1 / 2 * modedepth) * ymin)), (mode2(i), 0)], i, 1, nummode2) → modepos2Segment((Min[mode1], ((1 / 2 * modedepth) * ymin)), (Max[mode1], ((1 / 2 * modedepth) * ymin))) → modebar1Segment((Min[mode2], ((1 / 2 * modedepth) * ymin)), (Max[mode2], ((1 / 2 * modedepth) * ymin))) → modebar2Segment(((Min[mode1] + Max[mode1]) / 2, (modedepth * ymin)), ((Min[mode1] + Max[mode1]) / 2, ((1 / 2 * modedepth) * ymin))) → modelabel1Segment(((Min[mode2] + Max[mode2]) / 2, (modedepth * ymin)), ((Min[mode2] + Max[mode2]) / 2, ((1 / 2 * modedepth) * ymin))) → modelabel2Point(thexaxis) → B12BarChart(Sequence[11], freq1, 0.8) → dist1BarChart(Sequence[11], freq2, 0.8) → dist2Point(thexaxis) → A11Point(thexaxis) → B11Point(thexaxis) → A1Point(thexaxis) → A2Point(thexaxis) → A3Point(thexaxis) → A4Point(thexaxis) → A5Point(thexaxis) → A6Point(thexaxis) → A7Point(thexaxis) → A8Point(thexaxis) → A9Point(thexaxis) → A10Point(thexaxis) → B1Point(thexaxis) → B2Point(thexaxis) → B3Point(thexaxis) → B4Point(thexaxis) → B5Point(thexaxis) → B6Point(thexaxis) → B7Point(thexaxis) → B8Point(thexaxis) → B9Point(thexaxis) → B10
AI 绘图提示语参考
画两条分布曲线,分别表示两个不同的分布。在x轴上标出两个分布的模式、中位数和期望值。模式是曲线峰值对应的位置,中位数是将曲线分成两半的垂直线,期望值是曲线下的面积中心。
以上提示语为根据原始绘图命令整理而来,仅供参考。