
三角形正态分布概率演示
几何画板及绘图内容加载中,请稍等……
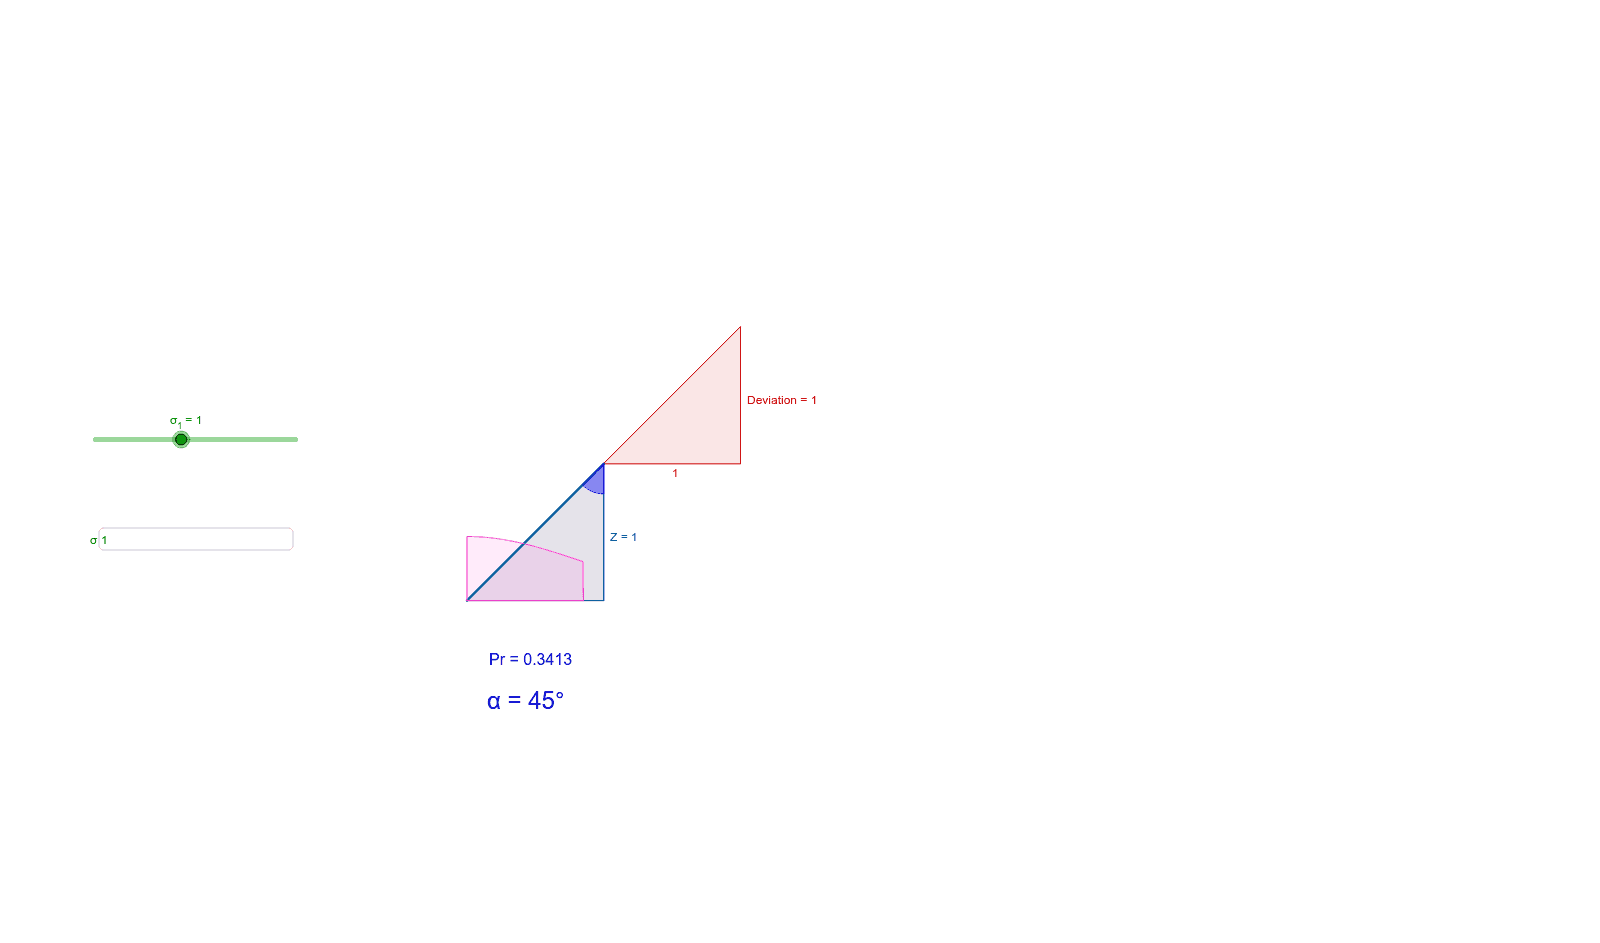
①本范例通过图形展示了正态曲线中涉及的各量关系;②涉及核心数学概念包括正态分布、积分、均值与标准差;③作图要点:运用了Integral(积分)、Point(点)、Polygon(多边形)、Slope(斜率)、Textfield(文本框)、Angle(角度)等GeoGebra命令与对象;④适合高中及以上数学学习者,用于理解正态分布的概率计算与几何意义。
GeoGebra 命令及参数
Integral(f_1, -Infinity, Infinity) → aIntegral(g, -10, 10) → sdPoint(d) → CPoint(d) → DPolygon(C, B, D) → poly1, d_1, c, hypPoint(hyp) → EPolygon(C, F, E) → poly2, f, c_1, χhypPoint(z) → GPolygon(C, B, G) → poly3, g_1, Z, b_1Slope(hyp) → DeviationPoint(h) → HIntegral(h, -200, 200) → ΣSTextfield(σ_1) → inputBox1Textfield(A) → inputBox2Textfield(n) → inputBox3Integral(g, 0, 0.851) → pIntegral(h(x) / σ_1, 0, 0.851) → probAngle(C, D, B) → αTextfield(σ_1) → InputBox1