
统计直方图与线性回归演示
几何画板及绘图内容加载中,请稍等……
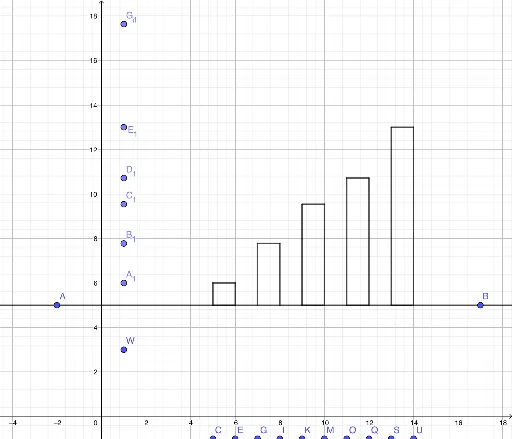
①本范例演示统计直方图的绘制及其与线性回归的关系;②涉及核心数学概念包括数据分布、频率直方图、线性回归方程、相关系数;③作图要点:使用Line、Point、Intersect、Segment等命令构建数据点、回归线及辅助线段;④适合高中数学教学,用于理解数据分析和统计建模基础。
GeoGebra 命令及参数
Line(A, B) → fLine(C, D) → gLine(E, F) → hLine(G, H) → iLine(I, J) → jLine(K, L) → kLine(M, N) → lLine(O, P) → mLine(Q, R) → nLine(S, T) → pLine(U, V) → qLine(W, Z) → rPoint(r) → A_1Point(r) → B_1Point(r) → C_1Point(r) → D_1Point(r) → E_1Point(r) → F_1Point(r) → G_1Line(A_1, f) → sLine(B_1, f) → tLine(C_1, f) → aLine(D_1, f) → bLine(E_1, f) → cLine(F_1, f) → dLine(G_1, f) → eIntersect(g, f) → H_1Intersect(g, s) → I_1Intersect(f, h) → J_1Intersect(s, h) → K_1Intersect(i, f) → L_1Intersect(j, f) → M_1Intersect(i, t) → N_1Intersect(j, t) → O_1Intersect(k, f) → P_1Intersect(l, f) → Q_1Intersect(k, a) → R_1Intersect(l, a) → S_1Intersect(f, m) → T_1Intersect(n, f) → U_1Intersect(m, b) → V_1Intersect(n, p) → W_1Intersect(f, p) → Z_1Intersect(f, q) → A_2Intersect(n, b) → B_2Intersect(p, c) → C_2Intersect(q, c) → D_2Segment(I_1, K_1) → f_1Segment(K_1, J_1) → g_1Segment(I_1, H_1) → h_1Segment(H_1, J_1) → i_1Segment(N_1, L_1) → j_1Segment(N_1, O_1) → k_1Segment(O_1, M_1) → l_1Segment(R_1, P_1) → m_1Segment(S_1, Q_1) → n_1Segment(Q_1, P_1) → p_1Segment(S_1, R_1) → q_1Segment(V_1, T_1) → r_1Segment(B_2, U_1) → s_1Segment(T_1, U_1) → t_1Segment(V_1, B_2) → a_1Segment(C_2, Z_1) → b_1Segment(D_2, A_2) → c_1Segment(Z_1, A_2) → d_1Segment(C_2, D_2) → e_1Intersect(f, j_1) → E_2
AI 绘图提示语参考
画一个统计直方图和线性回归的演示图,包含多条直线和点,先画出几条基准线,再在这些线上创建点,通过点与线的交点构建辅助线段,最后用直线连接部分交点,展示数据分布、频率直方图、线性回归方程和相关性系数。
以上提示语为根据原始绘图命令整理而来,仅供参考。