
标准差演示
几何画板及绘图内容加载中,请稍等……
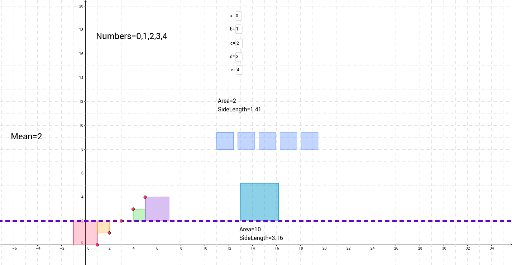
该范例演示了标准差的概念,涉及算术平均数、条形图和复数等核心数学概念。通过使用GeoGebra命令如Polygon、Vector和Translate,用户可以直观地理解数据的离散程度。适合高中及以上学生或教师使用。
GeoGebra 命令及参数
Polygon(Point1, Point1b, 4) → poly1, g, h, i, j, A, BPolygon(Point2, Point2b, 4) → poly2, k, l, m, n, C, DPolygon(Point3, Point3b, 4) → poly3, p, q, r, s, E, FPolygon(Point4, Point4b, 4) → poly4, t, a_1, b_1, c_1, G, HPolygon(Point5, Point5b, 4) → poly5, d_1, e_1, f_1, g_1, I, JPolygon(BigSquarePoint1, BigSquarePoint2, 4) → poly6, h_1, i_1, j_1, k_1, K, LPolygon(SmallSquarePoint1, SmallSquarePoint2, 4) → poly7, l_1, m_1, n_1, p_1, M, NVector((0, 0), ((1.25 * SideOfSmallSquare), 0)) → TranslationVectorTranslate(poly7, TranslationVector) → poly7'Translate(poly7, Vector[(TranslationVector * 2)]) → poly7'_1Translate(poly7, Vector[(TranslationVector * 3)]) → poly7'_2Translate(poly7, Vector[(TranslationVector * 4)]) → poly7'_3Textfield(a) → inputBox1Textfield(b) → inputBox2Textfield(c) → inputBox3Textfield(d) → inputBox4Textfield(e) → inputBox5