
QQ图
几何画板及绘图内容加载中,请稍等……
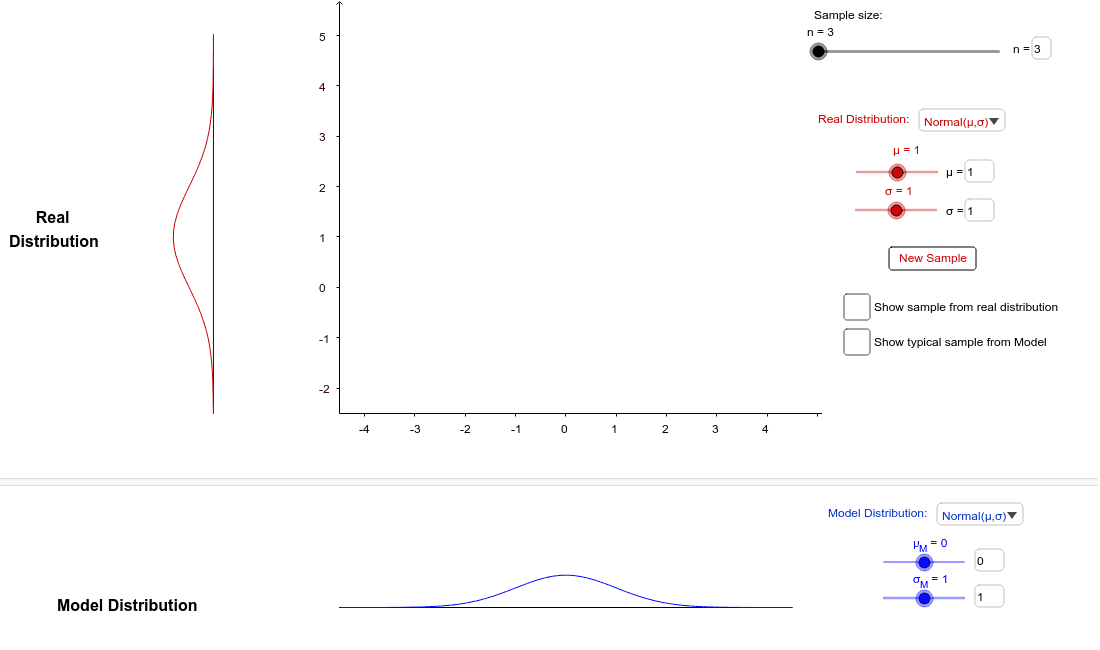
该范例演示了QQ图,这是一种用于比较两个数据集分布的图形方法。核心数学概念包括概率统计中的正态分布、伽马分布和指数分布。通过使用GeoGebra命令如RandomUniform、Sort、Mirror等,可以构造QQ图来直观地比较不同分布的数据集。适合高中及以上学生或统计学爱好者学习和研究。
GeoGebra 命令及参数
SelectedIndex(distributionsmodel) → SelectedModelSelectedIndex(distributionsreal) → SelectedRealRandomUniform(0, 1, n) → samplerealZip((-9, InverseNormal[μ, σ, yy]), yy, samplereal) → pointsrealNormalZip((-9, InverseGamma[3, β, yy] - 2), yy, samplereal) → pointsrealGammaZip((-9, InverseExponential[λ, yy] - 2), yy, samplereal) → pointsrealExpZip((-9, InverseGamma[s / 2, 2, yy]), yy, samplereal) → pointsreal2Zip((-9, ((-yy) + s) / sqrt((2 * s)) + 2.5), yy, y(pointsreal2)) → pointsrealSkewLeftZip((-9, (yy - s) / sqrt((2 * s))), yy, y(pointsreal2)) → pointsrealSkewRightIf(SelectedReal ≟ 1, pointsrealNormal, If[SelectedReal ≟ 2, pointsrealExp, If[SelectedReal ≟ 3, pointsrealGamma, If[SelectedReal ≟ 4, pointsrealSkewRight, pointsrealSkewLeft]]]) → pointsRealSort(y(pointsReal)) → ysortRealSequence(k / (n + 1), k, 1, n, 1) → pointsZip((InverseNormal[μ_M, σ_M, yy] - 3, 2.2), yy, points) → pointsmodelNormZip((InverseGamma[3, β_M, yy] - 7, 2.2), yy, points) → pointsmodelGammaZip((InverseExponential[λ_M, yy] - 7, 2.2), yy, points) → pointsmodelExpZip((InverseGamma[s_M / 2, 2, yy], 2.2), yy, points) → pointsmodel2Zip(((yy - s_M) / sqrt((2 * s_M)) - 3, 2.2), yy, x(pointsmodel2)) → pointsmodelSkewRightMirror(pointsmodelSkewRight, x = -3) → pointsmodelSkewLeftIf(SelectedModel ≟ 1, pointsmodelNorm, If[SelectedModel ≟ 2, pointsmodelExp, If[SelectedModel ≟ 3, pointsmodelGamma, If[SelectedModel ≟ 4, pointsmodelSkewRight, pointsmodelSkewLeft]]]) → pointsModelSort(x(pointsModel)) → xsortModelIf(SelectedReal ≟ 1, pointsrealNormal, If[SelectedReal ≟ 2, pointsrealExp, If[SelectedReal ≟ 3, pointsrealGamma, If[SelectedReal ≟ 4, pointsrealSkewRight, pointsrealSkewLeft]]]) → points1Sort(y(points1)) → points3Zip((InverseExponential[λ_M, yy] - 7, xx), yy, points, xx, points3) → FexpZip((InverseGamma[3, β_M, yy] - 7, xx), yy, points, xx, points3) → FgammaZip((x(xx), yy), xx, pointsModel, yy, points3) → FSkewRightZip((x(xx), yy), xx, pointsModel, yy, points3) → FSkewLeftauxZip((xx, yy), xx, xsortModel, yy, ysortReal) → FSkewLeftZip((InverseNormal[μ_M, σ_M, yy] - 3, xx), yy, points, xx, points3) → FnormGamma(s_M / 2, 2, x) → g_MGamma(s / 2, 2, x) → gGamma(3, β_M, x) → GammaModelNormal(μ_M, σ_M, x) → NormalModelExponential(λ_M, x) → ExpModelGamma(3, β, x) → GammaRealExponential(λ, x) → ExpRealNormal(μ, σ, x) → NormalRealIf(SelectedReal ≟ 1, σ, If[SelectedReal ≟ 2, 1 / λ^(2), 3 / β^(2)]) → varRealIf(SelectedReal ≟ 1, μ, If[SelectedReal ≟ 2, 1 / λ, 3 / β]) → meanRealElement(rulesreal, SelectedReal) → frealSort(samplereal) → samplerealordElement(rulesmodel, SelectedModel) → fmodelQ1(xpointsModel) → q1ModelQ3(xpointsModel) → q3ModelIf(SelectedModel ≟ 1, μ_M, If[SelectedModel ≟ 2, 1 / λ_M, 3 / β_M]) → meanModelIf(SelectedModel ≟ 1, σ_M, If[SelectedModel ≟ 2, 1 / λ_M^(2), 3 / β_M^(2)]) → varModelMax(x(pointsModel)) → xMaxpointsModelTranslate(Rotate[frealrestrict, 1.5708], (-10, 0)) → gNormSkewSegment((-10, -2.5), (-10, 5)) → RealpdfAxisSegment((-9, -2.5), (-9, 5)) → RealsampleAxisSequence(Text[i, (-7.9, i - 0.1)], i, -2, 5) → listyyNormSkewRightSequence(Text[i, (i - 3.1, -2.9)], i, -4, 4) → listxxNormSkewSequence(Text[i, (-7.9, i - 2.1)], i, 0, 7) → listyyExpGammaTranslate(Rotate[frealrestrict, 1.5708], (-10, -2)) → gExpGammaSegment((-7.5, 2.2), (1.5, 2.2)) → modelaxisIf(SelectedModel ≟ 1, Fnorm, If[SelectedModel ≟ 2, Fexp, If[SelectedModel ≟ 3, Fgamma, If[SelectedModel ≟ 4, FSkewRight, FSkewLeft]]]) → QQpointsElement(QQpoints, 2) → Min2QQElement(pointsModel, 2) → Min2ModelElement(pointsModel, n - 1) → MaxModelPolygon((x(Corner[1]) + 4.5, y(Corner[1]) + 0.8), (x(Corner[1]), y(Corner[1]) + 0.8), (x(Corner[1]), y(Corner[1])), (x(Corner[1]) + 4.5, y(Corner[1]))) → bottombar, k, l, m, pSegment(Min2Real, Min2QQ) → ASegment(Min2QQ, (x(Min2QQ), -4)) → DPolygon((x(Corner[4]), y(Corner[4])), (x(Corner[4]) + 4.6, y(Corner[4])), (x(Corner[4]) + 4.6, y(Corner[4]) - 0.7), (x(Corner[4]), y(Corner[4]) - 0.7)) → topbar, a_1, c, d, eNormal(0, 1, x) → SnormPolygon((x(Corner[2]) - 5.5, y(Corner[2])), Corner[2], Corner[3] + 1, (x(Corner[3]) - 5.5, y(Corner[3]) + 1)) → sidebar, a, f, h, iGamma(s / 2, 0.5, sqrt((2 * s)) + s) → bZip(InverseGamma[s / 2, 2, yy], yy, samplereal) → SkewpointsSequence(Text[i, (i - 7.1, -2.9)], i, 0, 8) → listxxExpGammaSegment((-7.5, 0), (1.5, 0)) → xaxisbottomSequence(Segment[Element[pointsModel, i], (x(Element[pointsModel, i]), 0)], i, 1, n) → LinesModelElement(QQpoints, n - 1) → Max2QQSegment(Max2Real, Max2QQ) → BSegment(Max2QQ, (x(Max2QQ), -4)) → ESegment((x(MaxModel), 3), (x(MaxModel), 2.2)) → LSegment((x(Min2Model), 3), (x(Min2Model), 2.2)) → JSequence(Text[i, (-7.9, i + 3 - 0.1)], i, -5, 2) → listyySkewLeftFractionText(1 / (n + 1)) → fraction1FractionText(1 / (n + 1)) → fraction2Textfield(μ) → μInputTextfield(σ) → σInputTextfield(λ) → λInputTextfield(β) → βInputTextfield(s) → sInputTextfield(μ_M) → μ_mInputTextfield(σ_M) → σ_MInputTextfield(λ_M) → λ_mInputTextfield(β_M) → β_mInputTextfield(s_M) → s_mInputPolygon((x(Corner[2]) - 5.5, y(Corner[2])), Corner[2], Corner[3] + 1, (x(Corner[3]) - 5.5, y(Corner[3]) + 1)) → sidebar2, j, q, r, tTextfield(n) → nInput
AI 绘图提示语参考
绘制QQ图(Quantile-Quantile Plot),用于比较两个数据集的分布。第一个数据集由随机数生成,服从正态、伽马或指数分布等;第二个数据集是这些分布的理论累积分布函数。QQ图将数据点与理论曲线对应,展示数据分布与理论分布的相似性。构造时,先生成随机样本,计算每个分位数对应的累积概率,然后绘制数据分位数与理论分位数曲线的对比图。
以上提示语为根据原始绘图命令整理而来,仅供参考。