
概率与树状图演示 by Dimitris Mirogiannis
几何画板及绘图内容加载中,请稍等……
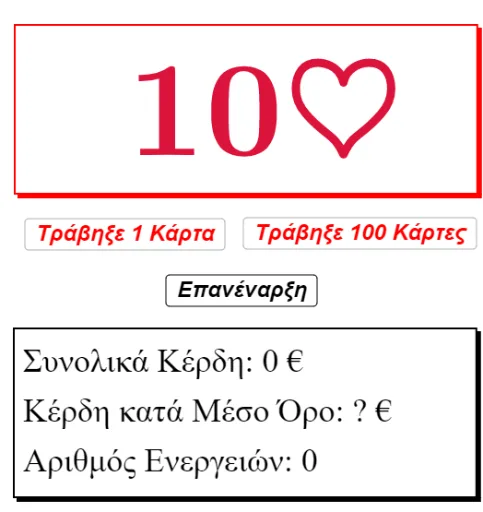
①本范例通过动态演示扑克牌抽样的概率过程,直观展示树状图的构建与应用;②涉及核心数学概念包括概率统计、百分数、双曲线、算术平均数、随机变量;③构造中运用了 GeoGebra 命令 Sequence(数列生成)、Join(连接)、Random(随机数生成)、Length(长度计算)、DotPlot(点图绘制)、CountIf(条件计数)、TableText(表格文本)、Sum(求和)、Element(元素提取)等;④适合高中阶段概率统计教学,可用于理解随机事件概率与数据可视化。
GeoGebra 命令及参数
Sequence(LaTeX["" + (w) + "\spadesuit", true], w, 2, 10) → L_1Join({L_1, L_2}) → spadesSequence(LaTeX["" + (w) + "\heartsuit", true], w, 2, 10) → L_3Join({L_3, L_4}) → heartsSequence(LaTeX["" + (w) + "\clubsuit", true], w, 2, 10) → L_5Join({L_5, L_6}) → clubsSequence(LaTeX["" + (w) + "\diamondsuit", true], w, 2, 10) → L_7Join({L_7, L_8}) → diamondJoin({clubs, diamond, hearts, spades}) → deckRandom(1, 52) → aLength(deck) → bDotPlot(win, false, 0.2) → L_9CountIf(x ≟ -7, win) → zeroCountIf(x ≟ 5, win) → fiveCountIf(x ≟ 10, win) → tenCountIf(x ≟ 30, win) → thirtyTableText({{"-7 €", " 5 €", "10 €", " 30 €"}, {zero, five, ten, thirty}}, "c|h") → text2Sum(win) → cSum(win) → totalElement(deck, a) → ww