
泊松分布计算器 by kamil_cyrkle
几何画板及绘图内容加载中,请稍等……
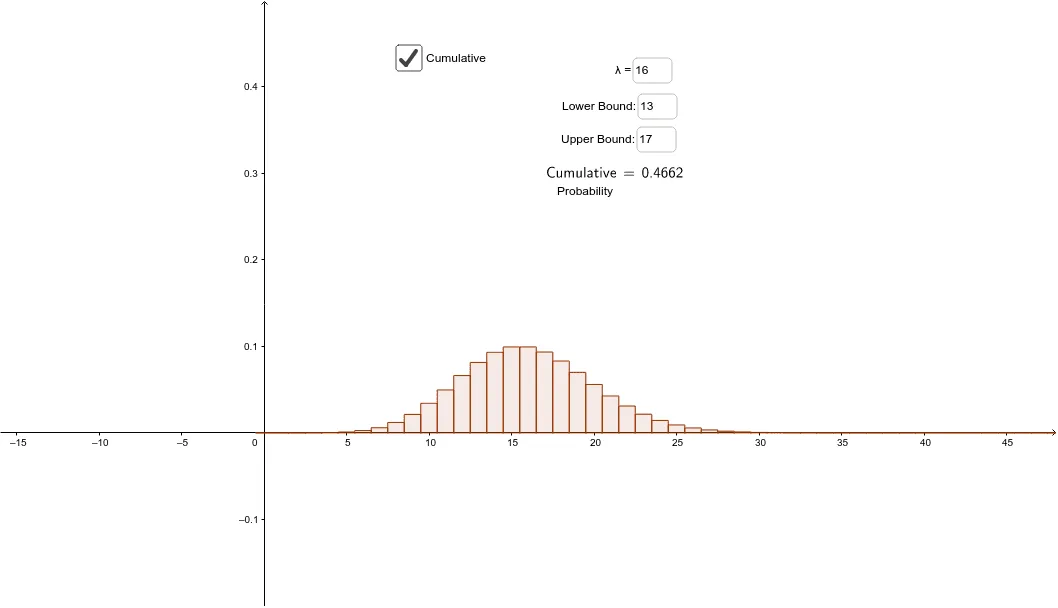
这个范例演示了泊松分布的计算与可视化。涉及的核心数学概念是概率统计中的泊松分布,通过动态交互展示不同参数λ下的概率分布情况。作图要点使用了Poisson、LaTeX、Textfield等GeoGebra命令和对象,如l、a、m、c、λ、k、Probability、text3、InputBox1、InputBox2、g、h、Cumulative、InputBox3、InputBox4、text1、text2等,适合高中及以上学生学习和理解概率统计中的关键分布模型。
GeoGebra 命令及参数
Poisson(m) → cPoisson(m, l, a) → ProbabilityLaTeX(Probability, true, true) → text3Textfield(m) → InputBox1Textfield(l) → InputBox2Poisson(m, g…h) → CumulativeTextfield(g) → InputBox3Textfield(h) → InputBox4LaTeX(Cumulative, true, true) → text1