
水管工收费问题:一次函数图像的应用
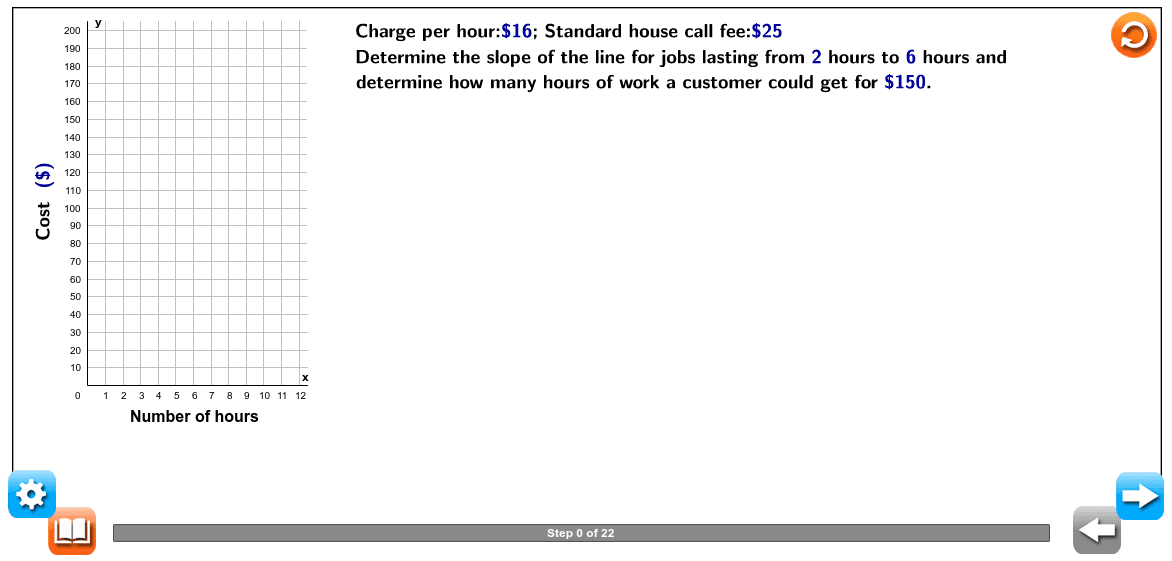
几何画板及绘图内容加载中,请稍等……
本范例演示一位新开业的水管工如何通过线性定价策略吸引顾客,他以每小时16美元的价格提供服务。核心数学概念是一次函数(y = mx + b)的图像表达与实际应用,其中16美元/小时体现了函数的斜率(单价),固定费用或最低收费则对应截距。作图要点:利用GeoGebra的Slider滑块动态调整时间参数,通过Segment命令绘制坐标轴线段,用Polygon构建面积图展示总费用,用If条件语句处理不同收费区间的计算,并配合TableText制作数据表格直观呈现费用变化。适合初中至高中数学课程,可用于讲解一次函数概念、斜率与截距的实际意义,以及函数图像在日常生活中的应用。
GeoGebra 命令及参数
Polygon(A, B, C, D) → Toppoly1, a, b, c, dPolygon(E, F, G, H) → Rightpoly1, e, f, g, hVerticalText("\text{Cost \textcolor{#000099}{(\textdollar)}") → VertYaxisLaTeX("\text{Create a table to show how the two quantities described vary.}") → Pg1ALaTeX("\text{The two quantities described are the number of hours and the total cost of the work.}") → Pg1BLaTeX((((("\text{\textcolor{#000099}{" * S2) * "} to include the \textcolor{#000099}{\textdollar") * S2) * "} house call fee.}")) → Pg1DLaTeX((("\text{The total cost can be determined by multiplying the number of hours by \textcolor{#000099}{" * S1) * "} and then adding}")) → Pg1CLaTeX("\text{Choose several values for the number of hours and calculate the associated cost.}") → Pg1FLaTeX("\text{Graph the relationship.}") → Pg2ALaTeX("\text{Use the table of values to graph the relationship.}") → Pg2BLaTeX("\text{Let \textcolor{#000099}{x} represent the number of hours and \textcolor{#000099}{y} represent the cost in dollars.}") → Pg2CLaTeX("\text{Determine the slope and what it means in the context of the problem.}") → Pg3ALaTeX("\text{Subtract.}") → Pg3JLaTeX("\text{Simplify.}") → Pg3KLaTeX((("\text{How can the slope be used to determine how many hours of work a customer could get for \textcolor{#000099}{\textdollar" * S3) * "}?}")) → Pg4CLaTeX((("\text{The number of hours of work that would cost \textcolor{#000099}{\textdollar" * S3) * "} can be estimated from the graphed values.}")) → Pg4DLaTeX("\text{\textcolor{#000099}{x}-coordinate.}") → Pg4FSegment(GF, (x(GF), 0)) → iOrthogonalLine(GF, i) → jOrthogonalLine(I, j) → kIntersect(j, k) → JSegment(GF, J) → lVector(G0, GF) → uMod(F1, CF1) → CondIf(Cond ≠ 0, LaTeX[(((("\text{customer could get a full \textcolor{#000099}{" * FF1) * "} hours of work and part of another hour for \textcolor{#000099}{\textdollar") * S3) * "}.}")], LaTeX[(((("\text{customer could get a full \textcolor{#000099}{" * FF1) * "} hours of work for \textcolor{#000099}{\textdollar") * S3) * "}.}")]) → Pg1JLaTeX((("\text{Standard call fee=\textdollar" * S2) * "}")) → DKT2Vector(G0, Gtry) → FnlvLaTeX((("\text{problem that each hour of work costs \textcolor{#000099}{\textdollar" * SUG) * "}.}")) → Pg4BLaTeX("\text{solve for \textcolor{#000099}{y}.}") → Pg1GneLaTeX("\text{Slope formula}") → Pg3GLaTeX("\text{slope\textcolor{#000099}{ =\frac{y₂-y₁}{x₂-x₁}}}") → Pg3ELaTeX((((("\text{slope\textcolor{#000099}{ =\frac{(" * G2) * ")-(") * G1) * ")}{(2)-(1)}}}")) → Pg3FLaTeX((("\text{slope\textcolor{#000099}{ =\frac{" * SUG) * "}{1}}}")) → Pg3HLaTeX((("\text{slope\textcolor{#000099}{ =" * SUG) * "}}")) → Pg3LLaTeX((("\text{determine how many hours of work a customer could get for \textcolor{#000099}{\textdollar" * S3) * "}.}")) → Question3LaTeX("\text{Determine the slope of the line for jobs lasting from \textcolor{#000099}{2} hours to \textcolor{#000099}{6} hours and}") → Question2LaTeX((((("\text{Charge per hour:\textcolor{#000099}{\textdollar" * S1) * "}; Standard house call fee:\textcolor{#000099}{\textdollar") * S2) * "}}")) → Question1LaTeX((((("\text{Therefore, the equation that represents this scenario is \textcolor{#000099}{y = " * S1) * "x + ") * S2) * "}.}")) → Pg1ETableText({{LaTeX["\text{\mathbf{Number\;of\;hours}}"], LaTeX[(("\text{\textcolor{#000099}{" * H1) * "}}")], LaTeX[(("\text{\textcolor{#000099}{" * H2) * "}}")], LaTeX[(("\text{\textcolor{#000099}{" * H3) * "}}")], LaTeX[(("\text{\textcolor{#000099}{" * H4) * "}}")], LaTeX[(("\text{\textcolor{#000099}{" * H5) * "}}")], LaTeX[(("\text{\textcolor{#000099}{" * H6) * "}}")]}, {LaTeX["\text {\mathbf{Calculation}}"], LaTeX[(((((((("\text{\textcolor{#000099}{" * S1) * "(") * H1) * ") + ") * S2) * " = ") * G1) * " }}")], LaTeX[(((((((("\text{\textcolor{#000099}{" * S1) * "(") * H2) * ") + ") * S2) * " = ") * G2) * " }}")], LaTeX[(((((((("\text{\textcolor{#000099}{" * S1) * "(") * H3) * ") + ") * S2) * " = ") * G3) * " }}")], LaTeX[(((((((("\text{\textcolor{#000099}{" * S1) * "(") * H4) * ") + ") * S2) * " = ") * G4) * " }}")], LaTeX[(((((((("\text{\textcolor{#000099}{" * S1) * "(") * H5) * ") + ") * S2) * " = ") * G5) * "} }")], LaTeX[(((((((("\text{\textcolor{#000099}{" * S1) * "(") * H6) * ") + ") * S2) * " = ") * G6) * "} }")]}, {LaTeX["\text{\mathbf{Cost\, (\textcolor{#000099}{\textdollar})}}"], LaTeX[(("\text{\textcolor{#000099}{" * G1) * "}}")], LaTeX[(("\text{\textcolor{#000099}{" * G2) * "}}")], LaTeX[(("\text{\textcolor{#000099}{" * G3) * "}}")], LaTeX[(("\text{\textcolor{#000099}{" * G4) * "}}")], LaTeX[(("\text{\textcolor{#000099}{" * G5) * "}}")], LaTeX[(("\text{\textcolor{#000099}{" * G6) * "}}")]}}, "vc|_") → TableLaTeX((("\text{Determine the slope by using the slope formula, slope\textcolor{#000099}{=}\textcolor{#000099}{ \frac{y₂-y₁}{x₂-x₁}}. Let (\textcolor{#000099}{x₁,y₁}) be (\textcolor{#000099}{1},\textcolor{#000099}{" * G1) * "})}")) → Pg3BLaTeX((("\text{and (\textcolor{#000099}{x₂,y₂}) be (\textcolor{#000099}{2," * G2) * "}). Substitute these values into the slope formula to find the slope of}")) → Pg3CLaTeX("\text{the line, and then simplify.}") → Pg3DLaTeX((((("\text{Substitute \textcolor{#000099}{" * G1) * "} for \textcolor{#000099}{y₁}, \textcolor{#000099}{") * G2) * "} for \textcolor{#000099}{y₂}, \textcolor{#000099}{1} for \textcolor{#000099}{x₁}, and \textcolor{#000099}{2} for \textcolor{#000099}{x₂}.}")) → Pg3ILaTeX((((("\text{The slope is \textcolor{#000099}{" * SUG) * "}, or \textcolor{#000099}{\textdollar") * SUG) * "} per hour. This verifies the given information in the}")) → Pg4ALaTeX((("\text{Find \textcolor{#000099}{" * S3) * "} on the \textcolor{#000099}{y}-axis, and then look to the right to determine the corresponding }")) → Pg4EIf(Cond ≠ 0, LaTeX[(((("\text{From the graph, it appears that \textcolor{#000099}{\textdollar" * S3) * "} will pay for a little less than \textcolor{#000099}{") * CF1) * "} hours of work.}")], LaTeX[(((("\text{From the graph,it appears that \textcolor{#000099}{\textdollar" * S3) * "} will pay for \textcolor{#000099}{") * CF1) * "} hours of work.}")]) → Pg4GLaTeX((("\text{Using the rate of \textcolor{#000099}{\textdollar" * S1) * "} per hour, the number of hours can also be found by first subtracting}")) → Pg4HLaTeX((((((((("\text{\textcolor{#000099}{" * S2) * "} from \textcolor{#000099}{") * S3) * "} and then dividing the result by \textcolor{#000099}{") * S1) * "}. This yields a result of \textcolor{#000099}{") * F1) * "}; therefore, a}")) → Pg4ILaTeX("\text{\mathbf{slope} the measure of the rate of change of one variable with respect to another}") → WTK1LaTeX("\text{variable; slope\textcolor{#000099}{ =\frac{y₂-y₁}{x₂-x₁}}\textcolor{#000099}{ =\frac{\triangle y}{\triangle x}}\textcolor{#000099}{=\frac{rise}{run}}; the slope in the equation \textcolor{#000099}{y = mx + b} is \textcolor{#000099}{m}.}") → WTK2LaTeX((("\text{Charge per hour=\textdollar" * S1) * "}")) → DKT1LaTeX((("\text{Customer budget = \textdollar" * S3) * "}")) → text1LaTeX("\text{Let’s use \textcolor{#000099}{1}, \textcolor{#000099}{2}, \textcolor{#000099}{3}, \textcolor{#000099}{4}, \textcolor{#000099}{5}, and \textcolor{#000099}{6}. Substitute each of the values for \textcolor{#000099}{x} in the equation, and then}") → Pg1G