
百分比:销售问题、利润与损失
几何画板及绘图内容加载中,请稍等……
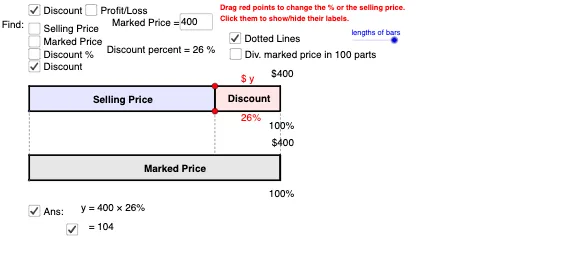
这个范例演示了百分比在销售问题中的应用,重点展示利润与亏损的计算过程。核心数学概念包括百分比计算、利润率、亏损率以及基本的几何作图技巧。作图要点包括使用Point、Polygon、Intersection等命令创建图形,利用Sequence生成数据列表,应用If条件控制变化,计算成本与利润变化,并通过Midpoint和Segment绘制相关线段。适合初中生或高中数学学习,用于理解商业数学应用和几何作图方法。
GeoGebra 命令及参数
Point(yAxis) → APoint(yAxis) → BPoint(Segment[A, A + ((length * maxchange), 0)]) → PPoint(Segment[A + (0, width), A + ((length * maxchange), width)]) → QPolygon(A, P, P + (0, width), A + (0, width)) → poly1, poly1a, poly1d, poly1b, poly1cPolygon(B, B + (length, 0), B + (length, width), B + (0, width)) → poly2, poly2b, poly2a, poly2c, poly2dIntersect(Ray[P, P + (1, 0)], x = length) → A1Intersect(Ray[Q, Q + (1, 0)], x = length) → A2Intersect(Ray[B1, B1 + (1, 0)], x = x(P)) → P'Intersect(Ray[B2, B2 + (1, 0)], x = x(P)) → Q'Polygon(P, Q, A2, A1) → poly3, poly3b, poly3b_1, poly3d, poly3cPolygon(B1, B2, Q', P') → poly4, poly4c, poly4d, poly4b, poly4aSequence(Segment[B + ((i * length / 10), 0), B + ((i * length / 10), width)], i, 1, 9) → list1Sequence(Sequence[Segment[B + ((j * length / 100) + (i * length / 10), 0), B + ((j * length / 100) + (i * length / 10), width)], j, 1, 9], i, 0, 9) → list2Sequence(Segment[A + ((i * length / 10), 0), A + ((i * length / 10), width)], i, 1, 9) → list3Sequence(Sequence[Segment[A + ((j * length / 100) + (i * length / 10), 0), A + ((j * length / 100) + (i * length / 10), width)], j, 1, 9], i, 0, 9) → list4Textfield(cost) → inputBox1Textfield(cost) → inputBox2Midpoint(B, B2) → CMidpoint(A, Q) → DMidpoint(P, A2) → EMidpoint(B1, Q') → FMidpoint(B1, Q') → GTextfield(price) → inputBox3Midpoint(P, A1) → HMidpoint(poly4a) → IMidpoint(poly3b_1) → JMidpoint(poly4d) → KIf(o_2, "$ y", "$" + cost) → text9If(o_2, "$ y", "$" + cost) → text4If(o_3, "y %", (abs(change_%) * "%")) → text11If(o_1, "$ y", "$" + price) → text13If(change_% < 0, "-", "+") → text24If(o_3, "y %", (abs(change_%) * "%")) → text17If(o_3, (("1 " * text24) * " y %"), "1 " + ((((text24 * " ") * abs(change_%)) * "%"))) → text34If(o_3, (("1 " * text24) * " y %"), "1 " + ((((text24 * " ") * abs(change_%)) * "%"))) → text14If(o_1 ∨ o_4, If[o_1, "$ y", (((cost * " ") * text24) * " $ y")], "$" + price) → text12If(o_4, (((cost * " ") * text24) * " $ y"), "$" + price) → text15Textfield(price) → inputBox4Segment(B + (0, width), A) → gSegment(B2, A + (length, 0)) → iSegment(P, If[x(P) < length, Intersect[poly2c, x = x(P)], Intersect[poly4d, x = x(P)]]) → hSequence(Segment[A + ((i * length / 10), 0), A + ((i * length / 10), width)], i, 1, floor((x(P) / length * 10))) → list3_1Sequence(Sequence[Segment[A + ((j * length / 100) + (i * length / 10), 0), A + ((j * length / 100) + (i * length / 10), width)], j, 1, 9], i, 0, floor((x(P) / length * 10)) - 1) → list4_1Sequence(Segment[B + ((i * length / 10), 0), B + ((i * length / 10), width)], i, 1, floor((x(P) / length * 10))) → list5Sequence(Sequence[Segment[B + ((j * length / 100) + (i * length / 10), 0), B + ((j * length / 100) + (i * length / 10), width)], j, 1, 9], i, 0, floor((x(P) / length * 10)) - 1) → list6_1Sequence(Segment[A + ((j * length / 100) + (floor((x(P) / length * 10)) * length / 10), 0), A + ((j * length / 100) + (floor((x(P) / length * 10)) * length / 10), width)], j, 1, floor(((x(P) - (floor((x(P) / length * 10)) * length / 10)) / length * 100))) → list4_2Sequence(Segment[B + ((j * length / 100) + (floor((x(P) / length * 10)) * length / 10), 0), B + ((j * length / 100) + (floor((x(P) / length * 10)) * length / 10), width)], j, 1, floor(((x(P) - (floor((x(P) / length * 10)) * length / 10)) / length * 100))) → list6_2If(b ∧ change_% < 0, "Loss", "Discount") → text8If(b, "Cost", "Marked Price") → text6
AI 绘图提示语参考
绘制一个矩形区域,分为两个部分,分别表示成本和售价。在成本部分,绘制一系列垂直线段表示成本变化,售价部分也绘制一系列垂直线段表示售价变化。在两个矩形之间绘制两条斜线,表示成本和售价的转换关系。在矩形内绘制一些辅助线段,表示成本和售价的变化区间。在矩形上添加文本框,输入成本和售价的具体数值。
以上提示语为根据原始绘图命令整理而来,仅供参考。