
正态分布 by UNSW School of Mathematics and Statistics
几何画板及绘图内容加载中,请稍等……
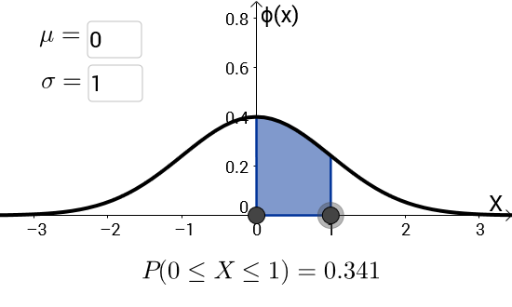
①本范例演示正态分布的概率密度函数图像及其特性;②涉及的核心数学概念包括概率统计、积分、函数图像;③作图要点——使用Textfield, Integral, 对象S, a, M, f, s, t, InputBox1, N, A, InputBox2, P1, P2, text1等GeoGebra命令和对象;④适合高中及以上学生学习和理解统计分布规律。
GeoGebra 命令及参数
Textfield(M) → InputBox1Integral(f, Min[s, t], Max[s, t]) → ATextfield(S) → InputBox2