
均值、中位数、众数与极差
几何画板及绘图内容加载中,请稍等……
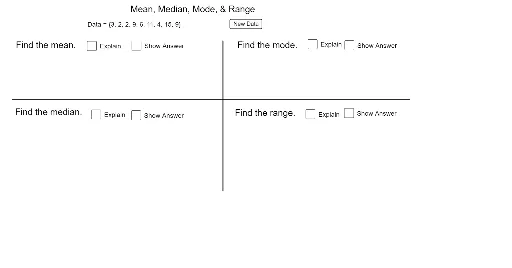
本范例演示如何计算一组数据的均值、中位数、众数与极差。核心数学概念包括统计学中的基本概念。通过使用 GeoGebra 的随机数生成、排序、计数等命令,可以直观地展示这些统计量的计算过程。适合初中及以上学生学习统计学基础知识。
GeoGebra 命令及参数
Random(Low, High) → JRandom(Low, High) → IRandom(Low, High) → HRandom(Low, High) → GRandom(Low, High) → FRandom(Low, High) → ERandom(Low, High) → DRandom(Low, High) → CRandom(Low, High) → BRandom(Low, High) → ASort({A, B, C, D, E, F}) → sL_6Sort({A, B, C, D, E, F, G}) → sL_7Sort({A, B, C, D, E, F, G, H, I, J}) → sL_8Sort({A, B, C, D, E, F, G, H, I}) → sL_9Sort({A, B, C, D, E, F, G, H, I, J}) → sL_5RandomElement({L_6, L_7, L_8, L_9, L_5}) → Final, {3, 2, 2, 9, 6, 11, 4, 15, 9}Max(Final) → HighestNumberMedian(Final) → MedianSort(Final) → SortFinalMin(Final) → LowestNumCountIf(x > -1, Final) → ElemsElement(SortFinal, 1) → A_sElement(SortFinal, 2) → B_sElement(SortFinal, 3) → C_sElement(SortFinal, 4) → D_sElement(SortFinal, 5) → E_sElement(SortFinal, 6) → F_sElement(SortFinal, 7) → G_sElement(SortFinal, 8) → H_sElement(SortFinal, 9) → I_sElement(SortFinal, 10) → J_sSegment(K, L) → lSegment(M, N) → m
AI 绘图提示语参考
绘制一组随机生成的数据点,然后计算并展示这组数据的平均数、中位数、众数和范围。首先生成10个随机数,然后对这些数进行排序,找出最大值、最小值和中位数。接着计算每个数出现的次数,找出众数。最后,用这些数据点画出两条线段。
以上提示语为根据原始绘图命令整理而来,仅供参考。