
弹珠袋模拟
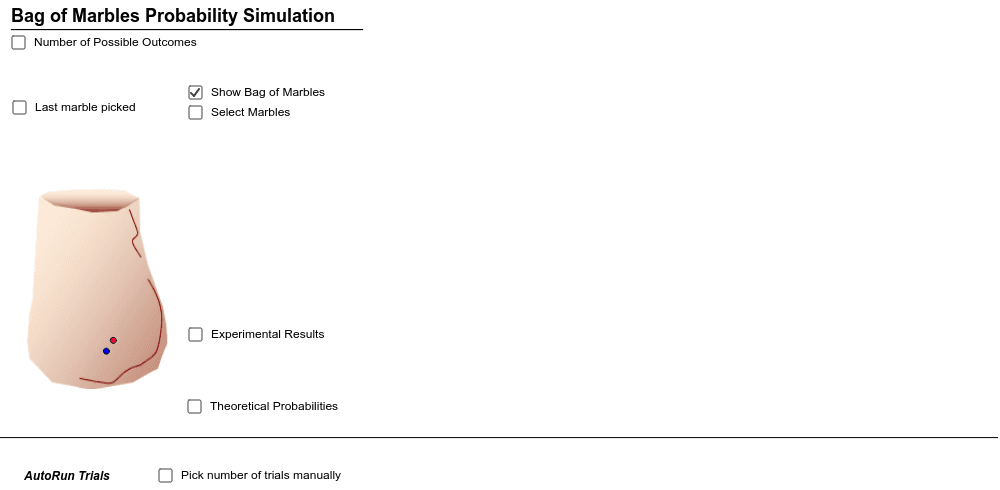
几何画板及绘图内容加载中,请稍等……
所属专题
Statistics Demonstrations
Statistics Demonstrations
Statistics Demonstrations
Statistics Demonstrations
Statistics Demonstrations
①本范例演示了从装有不同颜色弹珠的袋中随机抽取弹珠(可重复抽取)的过程,并通过条形图展示抽取结果的概率分布;②涉及的核心数学概念包括概率统计、百分比、比例、函数图像等;③作图要点——从下方『构造摘要』提炼用到了If, Circle, Sequence, CountIf, Vector, Element, Polygon, Midpoint, Line等GeoGebra命令/对象;④适合高中阶段学习概率统计、数据分析的学生使用。
GeoGebra 命令及参数
If(N_{colors} < -1, R, 0) → R2If(N_{colors} < -1 * 2, G, 0) → G2If(N_{colors} < -1 * 3, P, 0) → P2If(N_{colors} < 0, B, 0) → B2If(rand_{bag-blue} > 0.5, -1, 1) → posneg_{blue}If(rand_{bag-red} > 0.5, 1, -1) → posneg_{red}Circle(Drawn_{marble-center}, 0.3) → MarbleDrawnCircleRedCircle(Drawn_{marble-center}, 0.3) → MarbleDrawnCircleGreenCircle(Drawn_{marble-center}, 0.3) → MarbleDrawnCircleBlueCircle(Drawn_{marble-center}, 0.3) → fSequence((x(Marble_{bag-center}) + i * posneg_{red} * 0.05 * random(), y(Marble_{bag-center}) + 0.15 + 0.4 * random()), i, -8, R2 - 9) → Add_{marbles-to-bag-red}If(rand_{bag-green} > 0.5, -1, 1) → posneg_{green}Sequence((x(Marble_{bag-center}) + i * posneg_{green} * 0.05 * random(), y(Marble_{bag-center}) + 0.2 + 0.4 * random()), i, -8, G2 - 9) → Add_{marbles-to-bag-green}If(rand_{bag-purple} < 0.5, 1, -1) → posneg_{purple}Sequence((x(Marble_{bag-center}) + i * posneg_{purple} * 0.05 * random(), y(Marble_{bag-center}) + 0.25 + 0.5 * random()), i, -8, P2 - 9) → Add_{marbles-bag-purple}Sequence(ceil((random() + a - a) * (B + R2 + G2 + P2)) + i - i, i, 1, a) → List_{colors}CountIf(x ≤ B, List_{colors}) → Count_{blue}CountIf(B < x ≤ B + R2, List_{colors}) → Count_{red}CountIf(B + R2 < x ≤ B + R2 + G2, List_{colors}) → Count_{green}CountIf(B + R2 + G2 < x ≤ B + R2 + G2 + P2, List_{colors}) → Count_{purple}Circle((x(Marble_{bag-center}), y(Marble_{bag-center})), 0.03) → Marble_{blue}Vector(Marble_{bag-center}, D) → vElement(List_{colors}, a) → MarbleDrawnValueSequence((x(Marble_{bag-center}) + i * posneg_{blue} * 0.05 * random(), y(Marble_{bag-center}) + 0.1 + 0.4 * random()), i, -8, B2 - 9) → Add_{marbles-to-bag-blue}Polygon(BlueBarBottomLeft, BlueBarBottomRt, BlueBarTopRt, BlueBarTopLeft) → BlueBar, a_1, c_1, e_1, f_1Polygon(RedBarBottomLeft, RedBarBottomRt, RedBarTopRt, RedBarTopLeft) → RedBar, a_2, c_2, e_2, f_2Midpoint(BlueBarTopLeft, BlueBarTopRt) → BlueBarTopMidpointPolygon(GreenBarBottomLeft, GreenBarBottomRt, GreenBarTopRt, GreenBarTopLeft) → GreenBar, a_3, c, e, f_3Polygon(PurpleBarBottomLeft, PurpleBarBottomRt, PurpleBarTopRt, PurpleBarTopLeft) → PurpleBar, h, i, j, kMidpoint(RedBarTopLeft, RedBarTopRt) → RedBarTopMidptMidpoint(GreenBarTopLeft, GreenBarTopRt) → GreenBarTopMidptMidpoint(PurpleBarTopLeft, PurpleBarTopRt) → PurpleBarTopMidptLine(DividerLeft, DividerRight) → l
AI 绘图提示语参考
在一个袋子里随机抽取不同颜色的弹珠,展示抽取结果的概率分布。用条形图表示不同颜色弹珠的数量,并在袋子上绘制弹珠。先画出袋子和中心点,再随机生成红色、绿色、紫色弹珠并放置在袋子上。接着模拟抽取过程,在中心点绘制抽取的弹珠,并用条形图显示各颜色弹珠的数量分布。
以上提示语为根据原始绘图命令整理而来,仅供参考。